


Black Friday traditionally marks the start of big deals season after Thanksgiving in the US. While the largest sales spikes still occur on Black Friday, over the past few years, the annual mega-day has transformed into an international event that drives seasonal sales earlier and earlier each year, turning November into Cyber Month around the globe.
To help marketers prepare for the 2021 peak sales season, we studied our data to understand just how much sales increase in the weeks leading up to Black Friday in the US and around the world. We also analyzed path to purchase data in various regions to reveal surprising insights about the Black Friday consideration window.
Read on for exclusive data and insights from this analysis that can help inform your Black Friday ad strategy.

Global and Regional Black Friday Trends
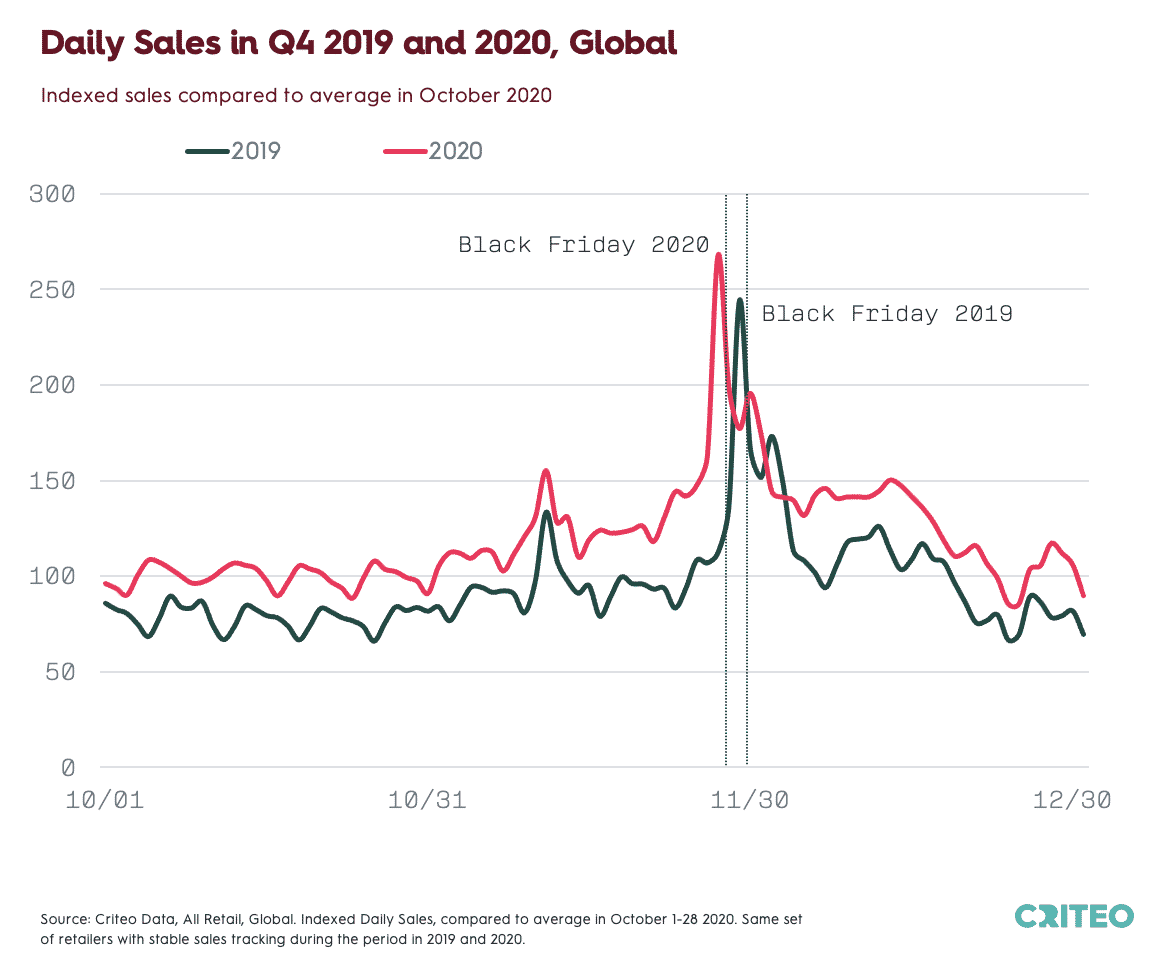
The following daily sales analyses are based on Q4 2019 and 2020 sales data from thousands of Criteo retail clients around the world, compared to the average from October 1-28, 2020.
Global: Sales Increased 28% YoY in the Weeks Leading Up to Black Friday
Online sales in October 2020 were already very high (up 25% year over year), which set the stage for an impressive Cyber Month in November 2020.
Thanks to consumers buying earlier sales in the first three weeks of November 2020 were up 28% year over year.
Global Black Friday 2020 sales more than doubled (+168%) compared to October of the same year. The 2019 Black Friday spike was more pronounced, at +213%.
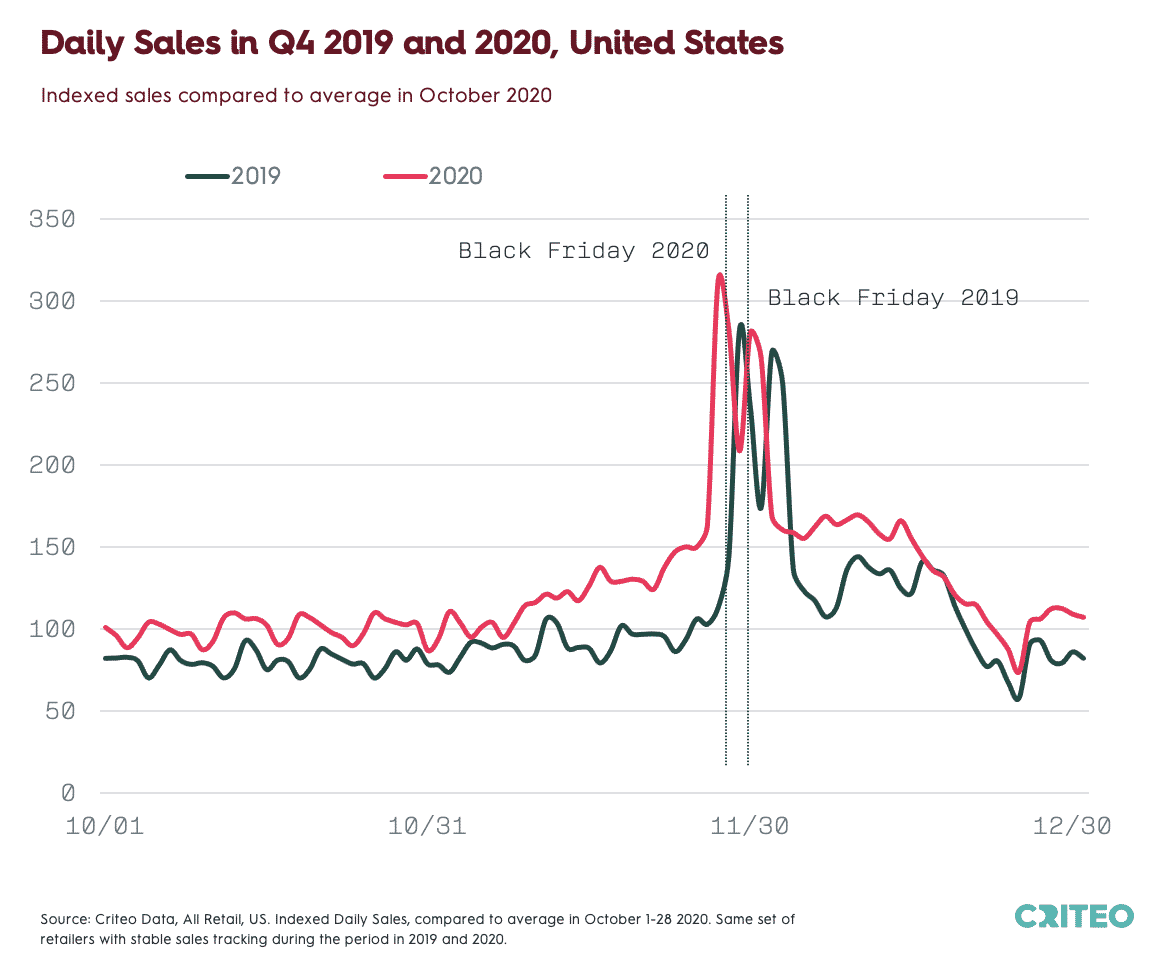
US: Cyber Month 2020 Sales Were Up 29% vs. 2019
October 2020 sales in the US were up 25% year over year, due to the impact of COVID-19 and a significant halo effect from Amazon Prime Day. The momentum continued, resulting in a 29% year over year increase in sales during the first three weeks of November.
Sales on Black Friday itself were +212% in 2020 vs. October. This is slightly less than the +253% spike in 2019.
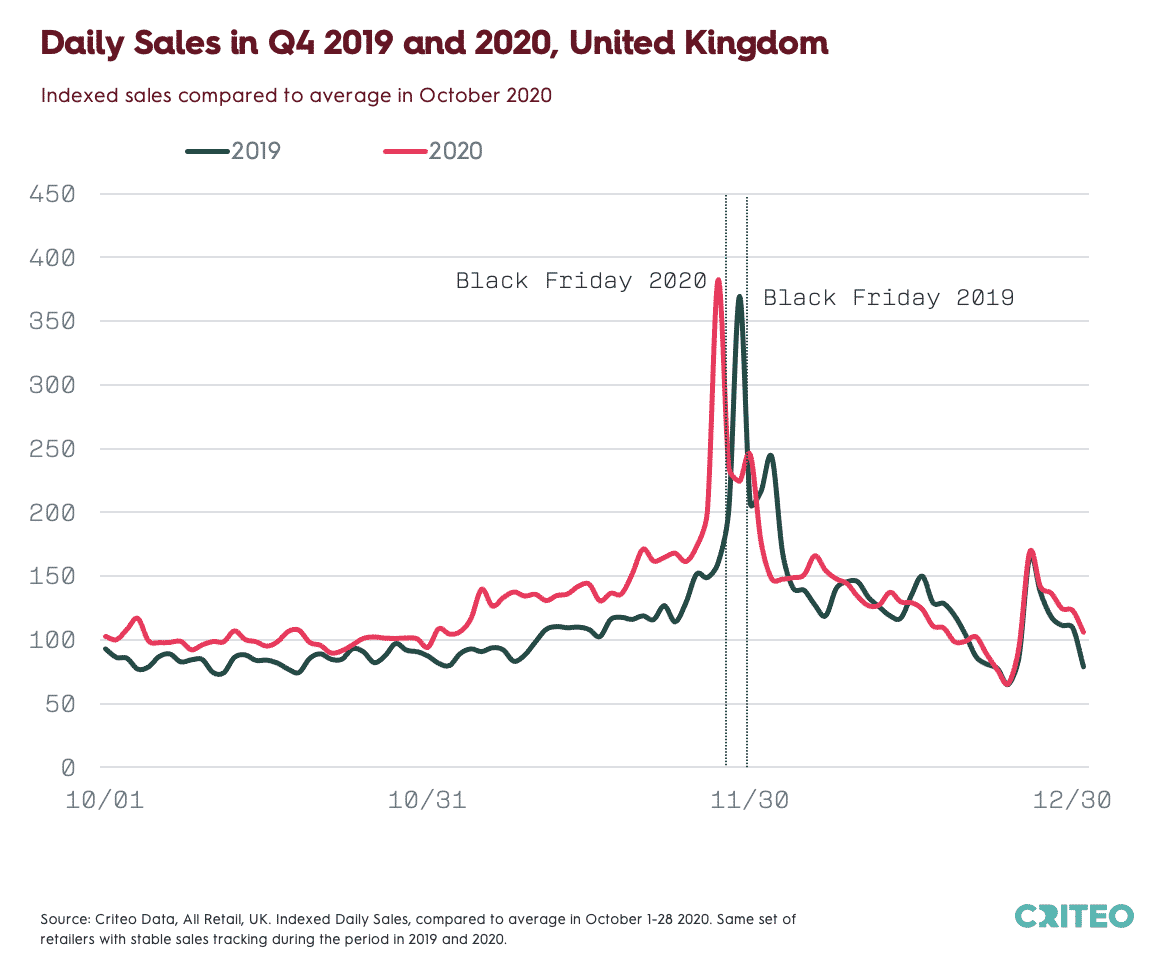
UK: Sales in November 2020 Grew 33% Year Over Year
In the UK, sales growth in the first three weeks of November was up 33% year over year.
Sales increased 283% on Black Friday compared to the average in October.
Another significant sales spike occurred on Boxing Day in late December, at +69% (versus October).
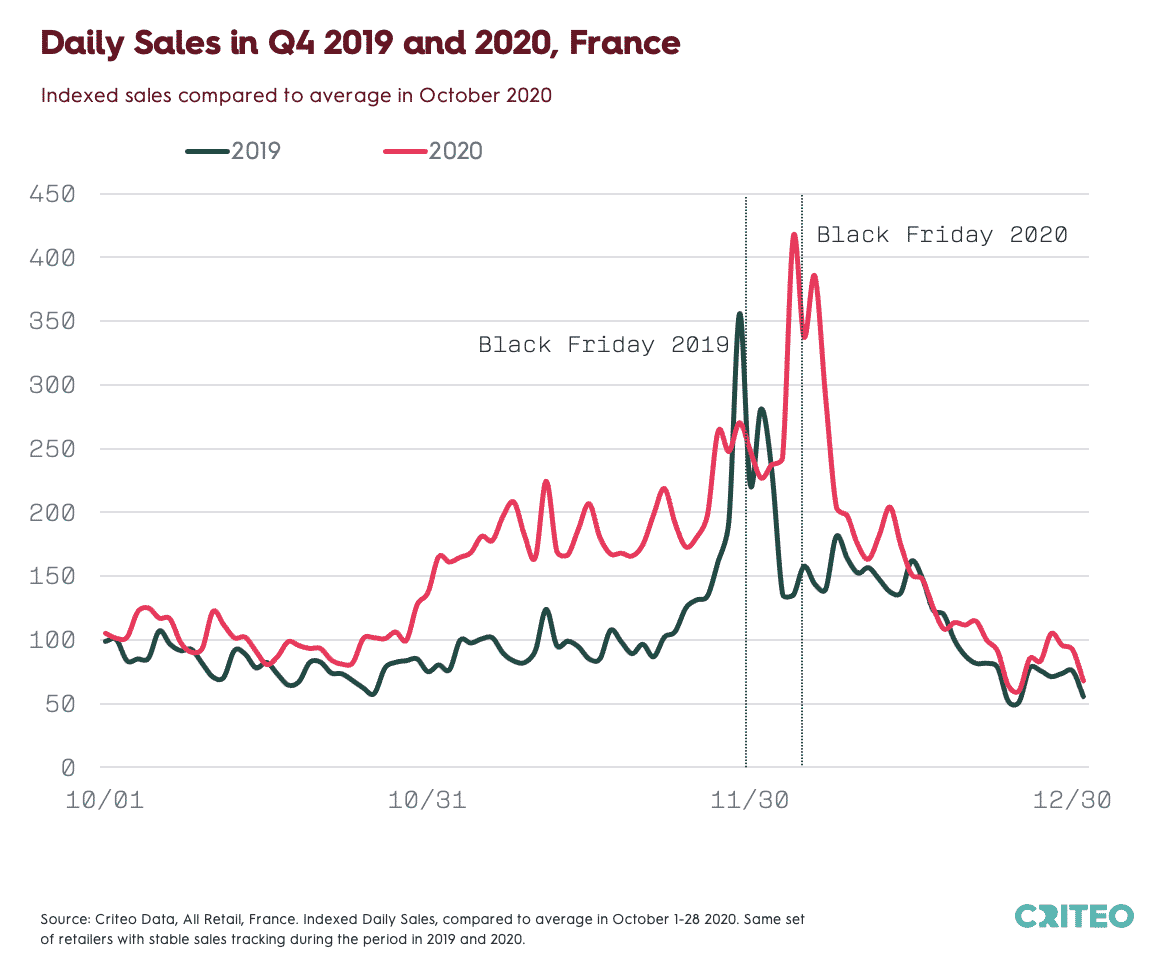
France: November 2020 Sales Increased 66% Year Over Year
The month of November brought major spending spikes in France. Sales grew 66% year over year during November 1-21, propelled by store closures.
Black Friday was postponed a week in France. This led to a whopping 316% sales increase on December 4 versus October.
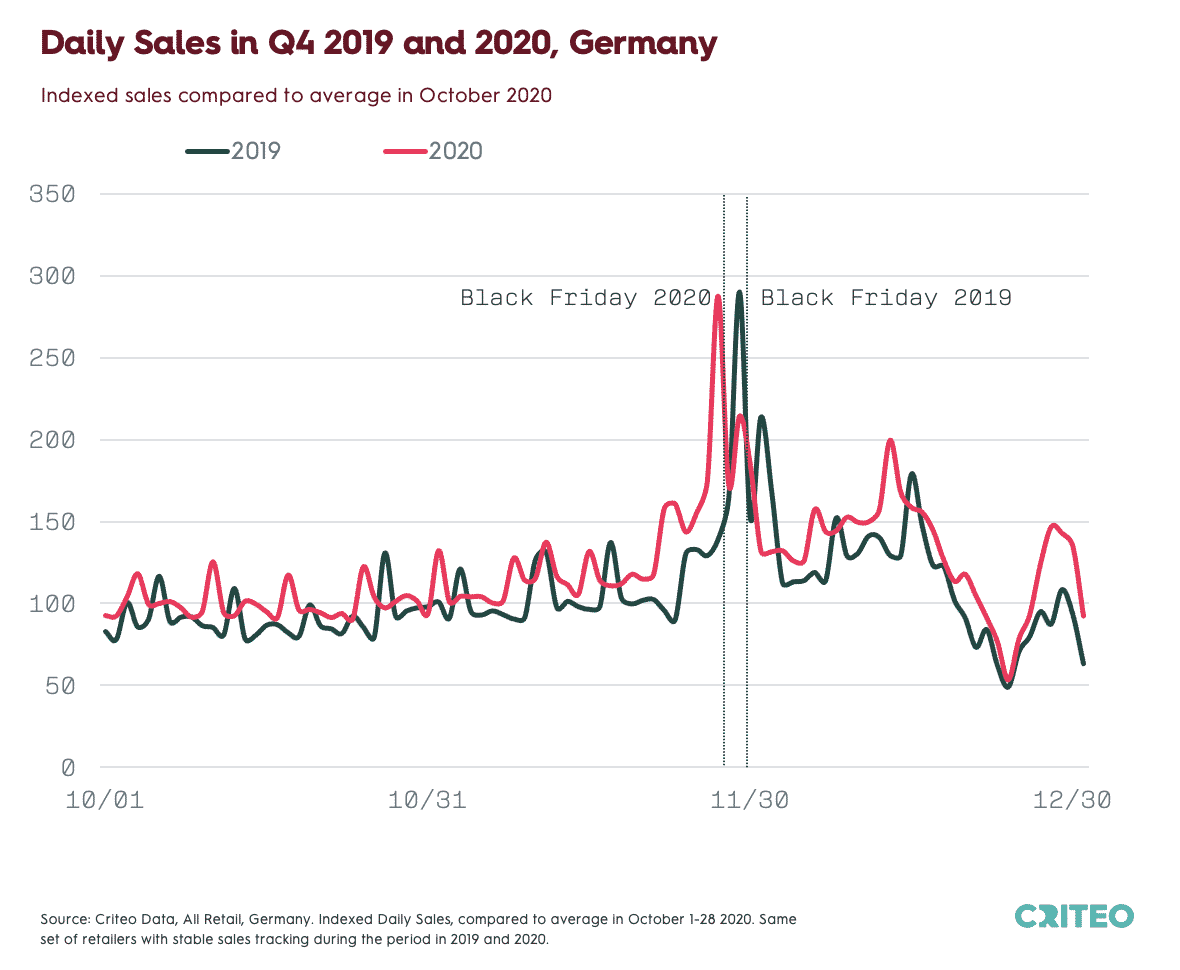
Germany: The 2020 Sales Spike Mirrored 2019
Sales in Germany rose 11% year-over-year during November 1-21, showing anticipation of the event (though less than we saw in the UK and France).
Black Friday 2020 sales rose 187% compared to October, which is just under the regional average and on par with 2019 levels.
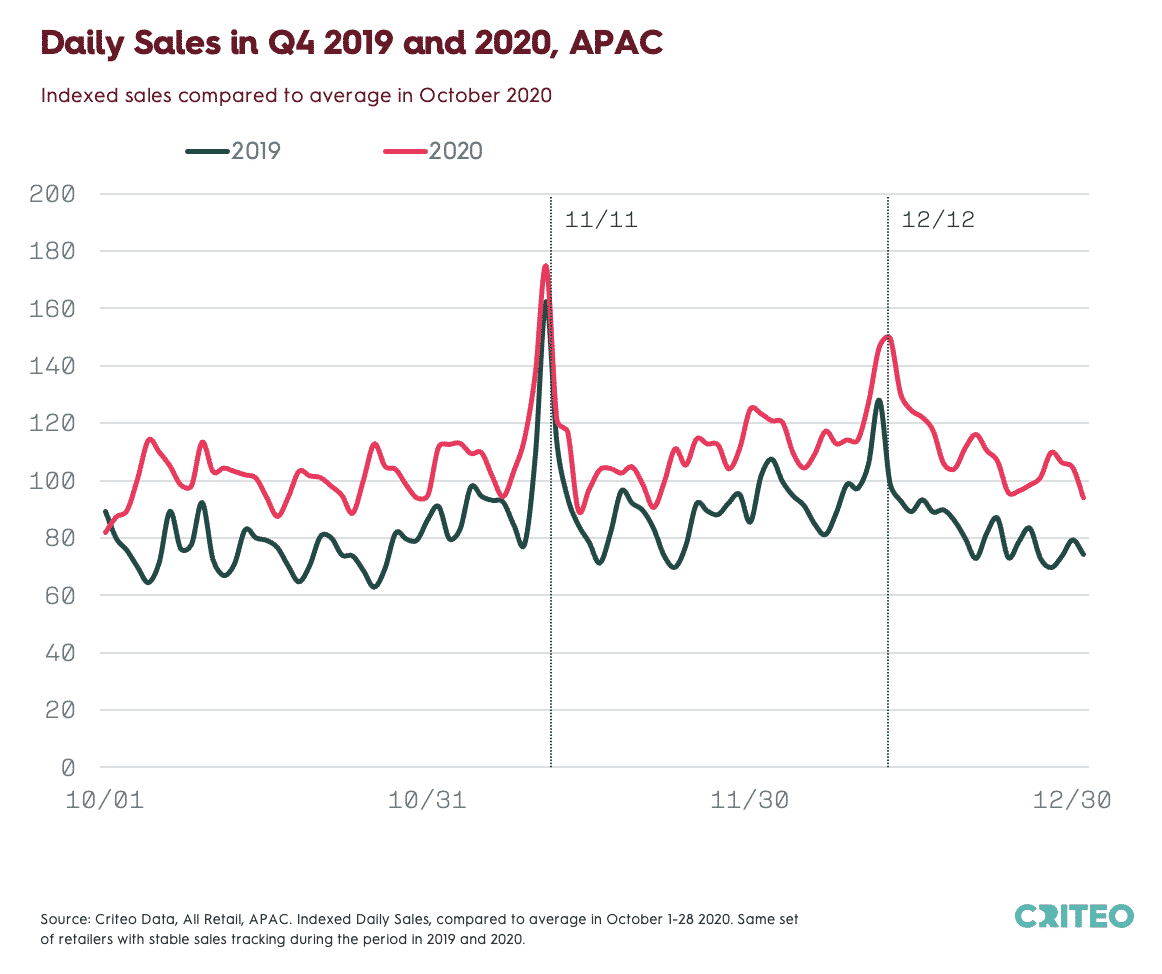
APAC: Sales in November Grew 19% Year Over Year
In APAC, sales growth in the first three weeks of November increased 19% year over year.
Singles’ Day and Double Twelve are the predominant spikes in Q4 in APAC, at +75% and +51%, respectively (versus the average in October), mostly due to their popularity in Southeast Asia.
South Korea had a 37% sales increase on Single’s Day. Japan does not have specific commercial events during this period and thus, no sales spikes.
Black Friday Path to Purchase: Consideration Windows by Region
Sales increase dramatically on Black Friday in many countries across the Americas, EMEA, and APAC. But what our data tells us is that shoppers aren’t making impulse buys, but rather, researching their Black Friday purchases well in advance of the actual event.
In fact, our data shows that on average, from first touchpoint to purchase, it takes a new customer two weeks in the US—and even longer in other countries—to make their Black Friday purchase decision.1
For marketers, this means that Black Friday campaigns need a consideration element that’s focused on reaching and driving consumers to their websites long before Black Friday in order to maximize sales on the big day.
Here are the regional breakdowns of the Black Friday path to purchase timeline:
- US: Average path to purchase: 14 days. Longest path to purchase: one month
- UK: Average path to purchase: 15 days. Longest path to purchase: one month
- France: Average path to purchase: 18 days. Longest path to purchase: six weeks
- Germany: Average path to purchase: 24 days. Longest path to purchase: eight weeks
- Japan: Average path to purchase: 34 days. Longest path to purchase: nine weeks
1Criteo Data, Apparel, US, Q4 2020, desktop and mobile combined.
The Early-Bird Opportunity for Advertisers
An October Amazon Prime Day in 2020 kickstarted big deals season. Retailers around the world, including major US retailers Walmart and Target, held their own Prime Day-style events at the same time to attract consumers who were already in the mood to shop.
More deals in October and November ahead of Black Friday disrupted the usual year-over-year sales increase and spread consumer spend out more evenly.
Prime Day 2021 has already come and gone, which means there is a wide-open opportunity for advertisers to drive discovery, consideration, and purchases well ahead of Black Friday. This, coupled with our path to purchase insights showing that marketers should be driving website visits anywhere from four to nine weeks before Black Friday, indicate that now is the time to get holiday marketing started.
For more holiday data and strategies, download The 2021 Holiday Commerce Report: