


Last week, Black Friday 2019 saw some of the highest-ever sales across the country. At Criteo, we analyzed our data across 1.9 billion monthly active shoppers to discover the highlights of the holiday. We’ve been hard at work to revolutionize the way we process the transaction data from Criteo Shopper Graph and, for the first time, we were able to dig deeper into category-level sales.
Here’s what we found:
1. Black Friday 2019 Sales Were 26% Higher than Black Friday 2018
We spent a lot of time last year looking at the trends and breaking down why Black Friday is now a global phenomenon. If you’re curious about sales by country, you can even take a look at our interactive seasonal dashboard here.
Black Friday 2019 started a week later than in 2018, but sales and traffic still started to rise right at the beginning of November. That’s apparently when many consumers start to shift into holiday mode. Then, there’s a dip in conversion rates around one to two weeks before Black Friday, likely as people wait for the real Black Friday deals.
All in all, Black Friday 2019 saw an average of 336% increase in sales and a 170% increase in traffic. Black Friday 2018 saw a 310% increase in sales. That represents a 26% higher sales spike this year than last year.
2. Health & Beauty Spiked the Most
When we took a look at which product categories saw the highest increase in sales during Black Friday 2019, Health & Beauty took the lead by a significant margin. Sales across Health & Beauty products rose by 464%. Sporting Goods came in second place, with a 426% increase. Computing and high tech retailers saw a 379% increase.
With a 343% increase, fashion & luxury items like clothes and jewelry were just above the toys & gadgets category (+320%).
3. The Opportunity Categories
It’s easy to look at the numbers from the highest product categories and see a success story for those retailers. The other story is to look at the categories with the lowest increase on Black Friday 2019: Home Improvement & Interior Design (+144%), Education, Family & Youth (+109%), and Culture / Media / Tickets (+56%).
These categories may not get as much attention during the holidays, because they’re not generally thought of as gifts for others. But for retailers and brands in these spaces, this could represent an opportunity to think about targeting specific audiences during the holidays and coming up with unique promotions.
Could you build ad campaign with a Black Friday special for event tickets? Museums? And how do you make sure that the campaign targets the people who would most likely be interested?
4. Thanksgiving Day = Another Sales Day?
It seems that after the family events, meals, and drama, there are quite a few people shopping around for things on their phones, too. That follows a pattern of high mobile sales, especially. There’s something to be said about the psychology of mobile purchases. This past Thanksgiving, we found that 59% of transactions were mobile.
People may be spending time with their family but, when they’ve got a few minutes to spare, they’re looking up deals. And, more often than not, it’s on their phones.
5. Apps Got More Popular.
With 59% of transactions taking place on mobile, Thanksgiving Day purchases were just slightly more device-centric than Black Friday 2019. On Black Friday, 57% of transactions took place on mobile. This is clearly still notable: the majority of digital purchases in 2019 were mobile.
App transactions in particular showed a marked increase since last year, with app sales increasing by 146% on Black Friday 2019 when compared to October 2019.
What Shoppers Say, What Shoppers Do
As we analyzed these numbers, we also crunched data on a survey we conducted of US shoppers that asked about their shopping plans for Black Friday.
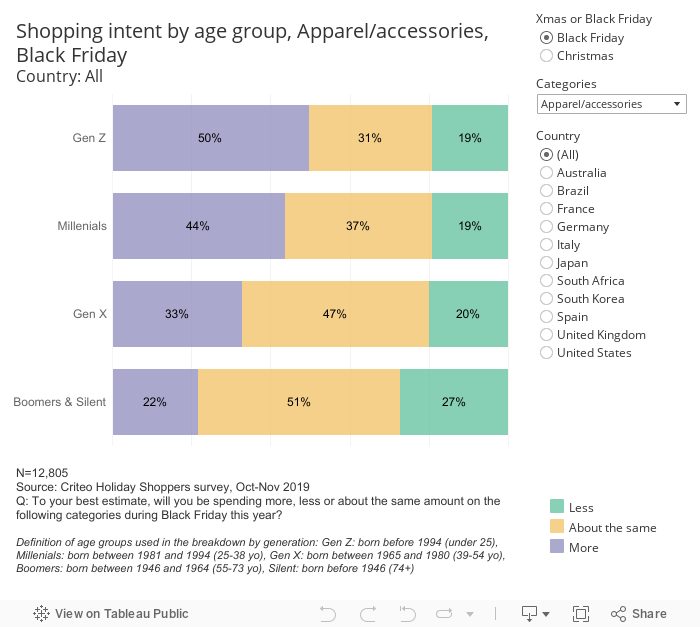
Did US shoppers plan on buying more beauty products?
Simply put, yes. When asked if they planned to spend more on beauty products during Black Friday, 31% of Gen Z and 32% of Millennial respondents said yes.
Want to segment further by country and generation? Check out the chart:
We also asked about what shoppers worldwide had planned to buy during Black Friday 2019:
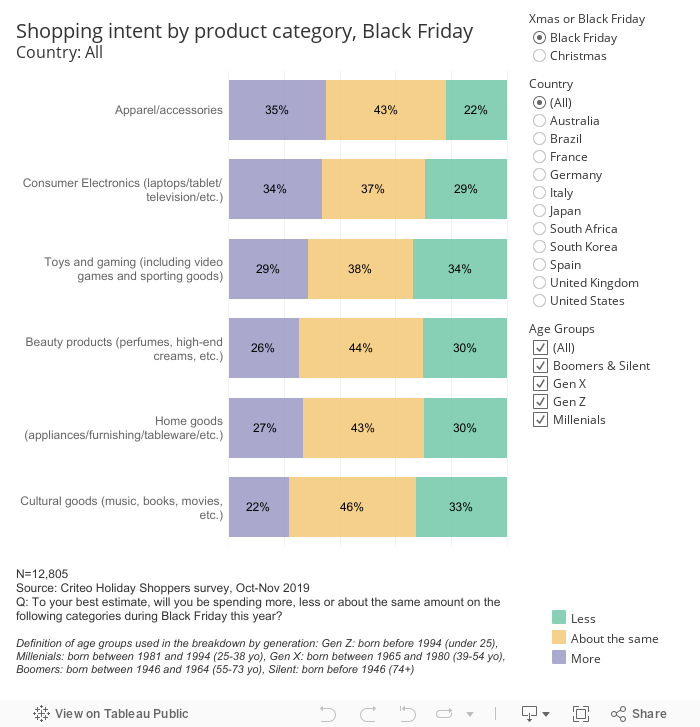
At Criteo, we were very interested to see the differences between product categories. To us, that’s an advertising problem – not a demand problem. Health & beauty may be most popular, but that’s clearly because it’s on everyone’s minds during Black Friday weekend. The increase in Sporting Goods was another surprising finding, but perhaps there are a lot of people getting into football season and thinking about winter sports during Thanksgiving.
While we all know that Black Friday is a surefire holiday for retailers of all types and sizes, it’s interesting to take a look at the numbers beneath the surface. This can help businesses better understand audience behavior and plan more strategically going forward.
If you want more insights on what happened last year and our recommendations based on the data, download our full holiday report below.