

We’re big fans of data at Criteo. So when we get the chance to take a deep dive across specific verticals, we’re excited to share what we find – especially in an industry as big as apparel.
This year, US retail ecommerce sales of apparel will reach $103.66 billion, making apparel the largest single product category comprising 19.7% of total ecommerce sales.
But this doesn’t mean that shoppers are doing the majority of apparel shopping online. Research shows that this is still a tactile event: 32% of US internet users are still more likely to complete a clothing purchase at a physical store than online.
So what did we find in our report? Well, we crunched the data and then looked at the macro trends across the market. Most importantly, we noticed that there’s no real distinction between channels.
When shoppers do shop online, they don’t tend to start their searches at search engines – they usually go directly to retailer sites. Apparel shoppers move seamlessly between online research and in-store purchase. Or they try on in-store, then stock up online. Our latest data shows that 35% of post-click sales completed on desktop are preceded by a click on another device – so shoppers may find something on their phones, but wait to buy it on their desktops.
Here’s what else we found:
1. Millennials lead online apparel shopping growth
In 2017, while overall online sales slowed for all ages, millennials were the only generation to see an increase in online apparel sales. They had the highest apparel growth rate of all generations at 4 percent, representing $2 billion in incremental sales.
Baby boomers accounted for nearly 20% of annual apparel sales, and Gen Z generated almost a third, but both generations spent less online overall in 2017.
In our recent Gen Z report, we find that while Gen Z is young – under 22 by most definitions – and most haven’t started their careers, they have significant spending power from allowances and part-time jobs.
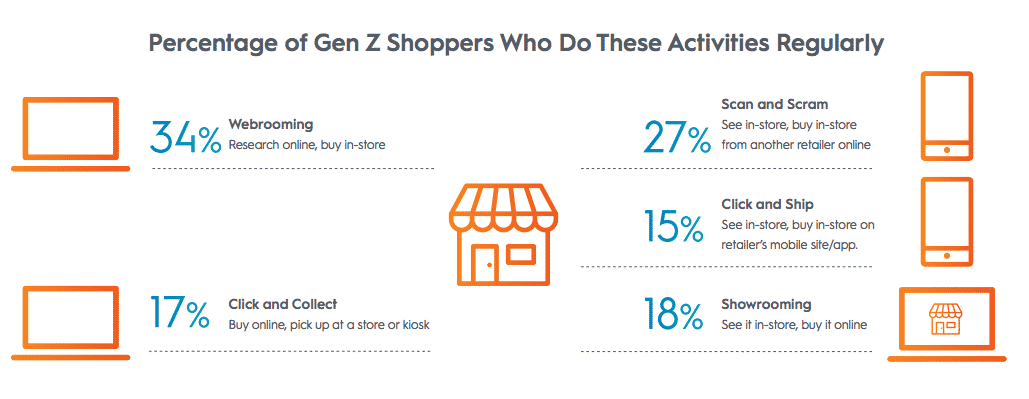
However, while they spend the most time on their mobile devices over any other generation, they also have a passion for IRL (in real life) retail and are, more than other generations, dissatisfied with the online experience. Our report found that 38% of Gen Z find it difficult to find what they need online.
2. Outside of the holiday season, spring is when apparel shoppers buy the most
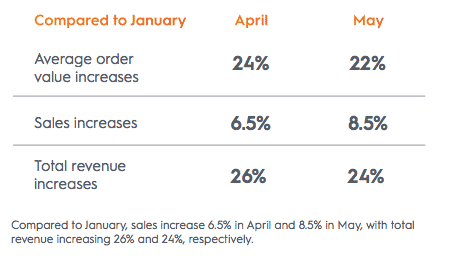
As the weather gets nicer, wardrobes start to change. Spring is the time for wardrobe refreshes as shoppers shed off their winter coats and prepare for warmer weather. Average order values in the apparel category reach their annual highest peaks in April and May with increases of 24% and 22% respectively, over January.
Compared to January, sales increase 6.5% in April and 8.5% in May, with total revenue increasing 26% and 24%, respectively.
3. Mobile accounts for most if not all sales growth in Apparel, but desktop still rules
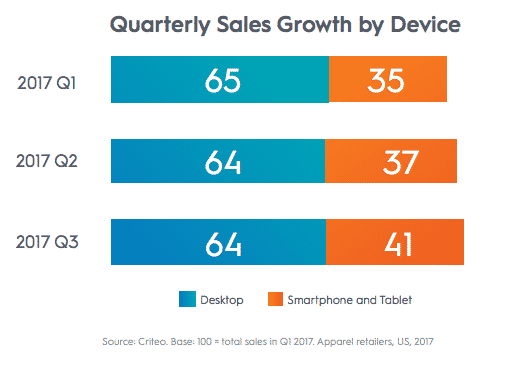
Between Q1 and Q3 2017, all sales growth came from mobile in the apparel category while desktop sales slightly decreased. The same increase in mobile transactions is expected for 2018.
4. Men and women shop differently…
….but both browse more than search
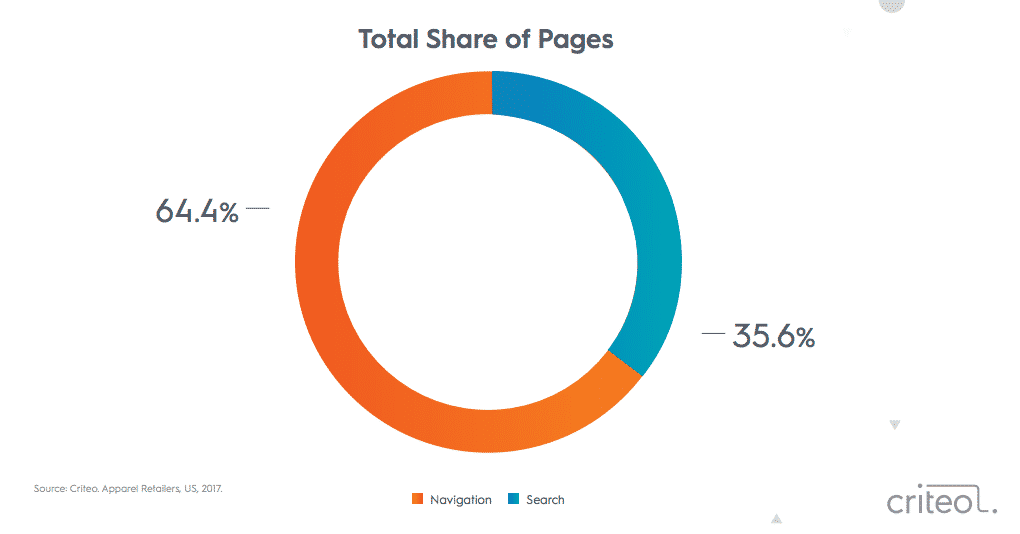
Overall, across relevant categories, both men and women browse more than search: 64% vs. 36%, but this varies by each category.
…Men browse more for casual shirts and women for jeans
When search and browse data is broken down by category and gender, we see that men and women’s search and browsing behavior don’t differ too much.
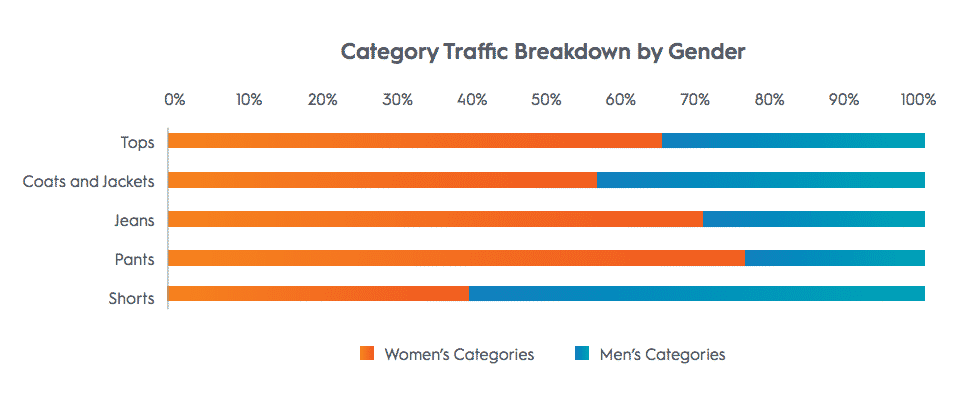
Men browse more for casual shirts, but this could be because for women, shirts is a much broader category with more SKUs than for men, which means women need to do more specific searches to find what they want. When it comes to jeans however, women are more open to browsing.
…Men’s categories tend to be purchased with more urgency
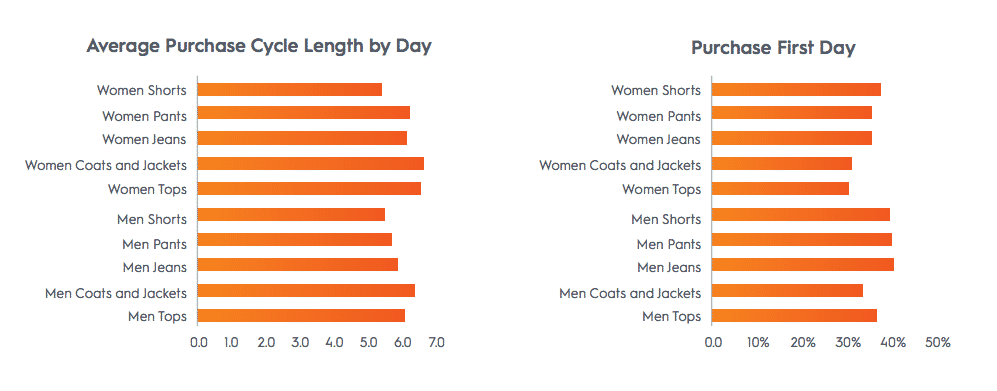
Not all men hate shopping, but for the most part men find what they want and then decide to buy it. Our data shows that across categories, women take longer to make purchase decisions than men do. In the case with pants, women take 8% longer to purchase. Men are more likely to purchase the first day they browse, and overall, a third of users purchase immediately.
The average purchase cycle for both men and women is under one week. Shorts, Coats, and Jackets have the longest purchase cycles across both genders, perhaps because Coats and Jackets are bigger investments and Shorts tend to be weekend apparel items.
…Pants and Jeans lead women’s category traffic
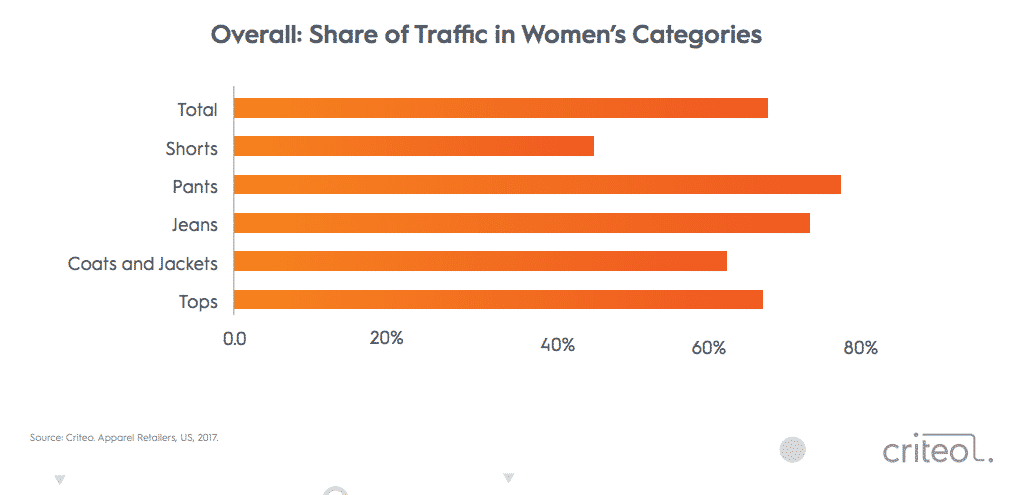
When looking at traffic breakdown by gender, women’s share of traffic in women’s categories show that traffic for pants and jeans are highest, with almost identical sales percentages. Though jeans are a specific category, pants is a much broader category that includes many different types and styles of pants, hence the larger share of traffic in the pants category.
5. Browsing starts rising in October and peaks between Thanksgiving and Christmas
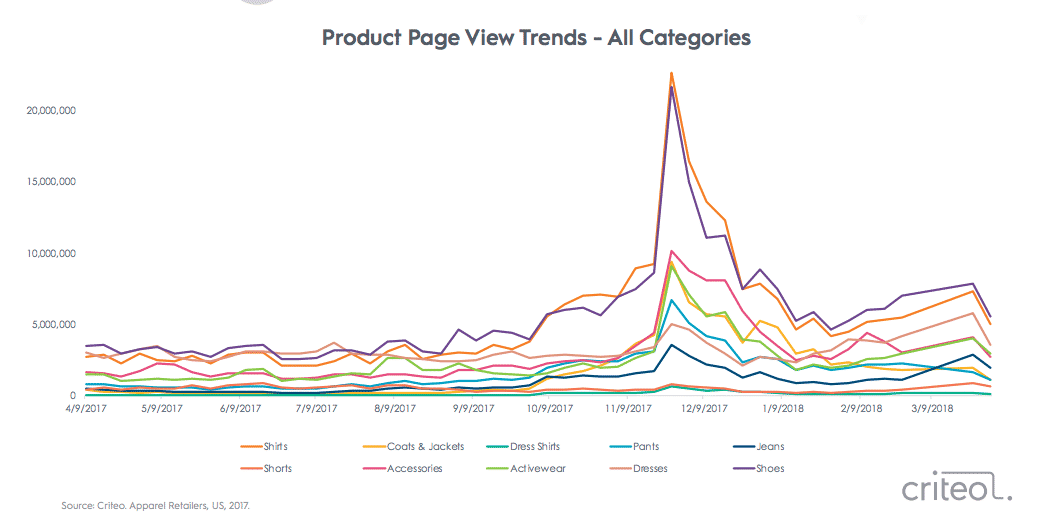
Product page views across all categories start steadily rising in October, when people are searching across all categories in preparation for the holidays. Then in November, Shirts and Shoes spike in product pageview trends above all categories. Accessories, activewear, and coats and jackets have an almost identical increase in product pageviews, indicating that these items are popular gifts for both others and for shoppers themselves.
When it comes to units sold in the same holiday peak however, shirts increases dramatically high above all other categories. Dramatic spikes in shirts, pants, shoes, and activewear can be seen around the holidays.
But shoes, pants, and accessories might be harder to gift after all, as the increase in units sold of shirts is the highest, indicating that both women and men are mostly gifting shirts – which is a broad category that includes many types of SKUS, from sweaters to tank tops to blouses.
The biggest conversions occur around Black Friday, meaning brands need to start “owning the shelf” in early September to close this opportunity gap. Using Coats and Jackets as an example at the category level, the day where conversions peak is the day right after Thanksgiving, where traffic and sales are nearly equal.
Retailers might not immediately see returns, but there is a clear opportunity gap when it comes to owning the shelf starting from early Q4.
Best Practices for Brands
1. Make SKU-level data more specific to help shoppers find what they need as they search
SKU-level data is critical to helping shoppers find what they need. SKU labels ensure shoppers land on specific product detail pages to help them find exactly what they want.
When it comes to what users want from websites, the ability to filter through products and read real, verified reviews are (21% and 19% respectively) the second and third most important features to shoppers. Secure checkout is the most important feature a web-store can have (35%).
Brands can stand out by making SKU labels more specific. For women, “shirts” encompasses blouses, tank tops, t-shirts, dress shirts, and everything in between.
2. Own the shelf early, and be patient
Product page views across all categories start rising steadily in October. Brands need to start “owning the shelf” in early September to take advantage of this period when shoppers might not be ready to buy, but they’re starting to browse.
And even after the holidays, there’s the opportunity to win more sales: once shoppers have their gift cards and returns in hand, they head back to the stores to shop for themselves. If your campaigns have been running since October, you may want to keep them running until after Christmas or the New Year to maximize return on ad spend (ROAS).
3. Use Sponsored Products to drive awareness and sales.
Criteo’s Sponsored Products, which are relevant to the purchaser and multiple-SKU categories like Apparel & Accessories, reach shoppers at the point of need. Apparel and accessories brands who use Criteo Sponsored Products saw a 51% increase in share of consideration, and a 47% increase in share of sales.
Sponsored Products have impact not only on retail sites, but also on brand sites as consumers tend to shop across sites before making their ultimate decision. With appropriate tagging, the impact of paid search on retail sites can be extended to the brand sites that are so important to many Apparel & Accessories sites.
Download the full report here. Want to learn more about Criteo Sponsored Products? Learn more here.