NEW YORK – August 4, 2021 – Criteo S.A. (NASDAQ: CRTO), the global technology company that provides the world’s leading Commerce Media Platform, today announced financial results for the second quarter ended June 30, 2021 that exceeded the Company’s quarterly guidance.
Second Quarter 2021 Financial Highlights:
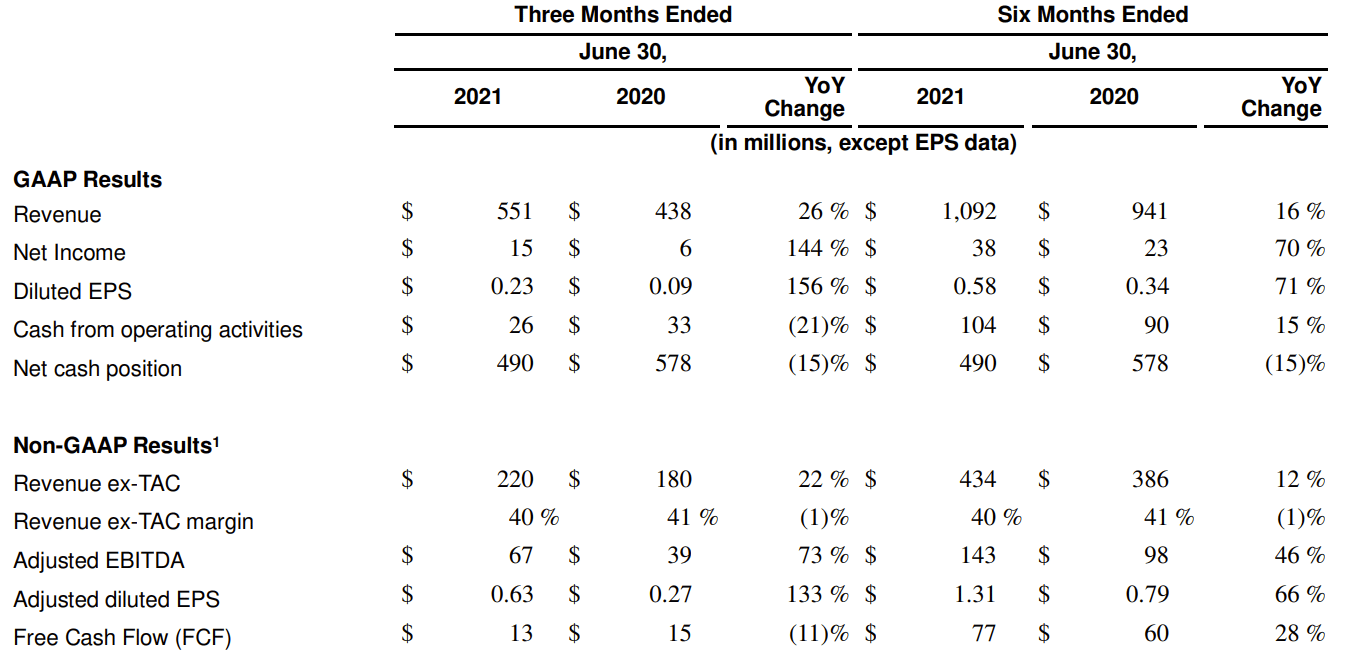
The following table summarizes our consolidated financial results for the three and six months ended June 30, 2021 and 2020:
“We continue to execute on our Commerce Media Platform strategy and are excited to see our vision coming to life,” said Megan Clarken, CEO. “We feel very good about our solid performance and continued momentum.”
Q2 2021 Operating Highlights
- The media spend we activated for marketers and media owners increased 31% year-over-year.
- New solutions grew 50% year-over-year at constant currency2 to 25% of total revenue ex-TAC.
- Retail Media revenue grew 10% and Retail Media Revenue ex-TAC grew 49% year-over-year at constant currency2. Same-retailer revenue ex-TAC3 for Retail Media increased 65% year-over-year.
- Criteo acquired Mabaya, a leading retail media technology company that powers sponsored products and retail media monetization for major ecommerce marketplaces globally.
- We added Best Buy and a large high-end fashion specialty retailer in the U.S to our Retail Media Platform.
- We added over 700 net new clients and closed the quarter with over 21,300 clients.
- Same-client revenue3 increased 22% and same-client revenue ex-TAC2 increased 16% year-over-year at constant currency2.
- We expanded our Product leadership team, with a series of key hires to accelerate Product innovation and Go-to-Market.
- During our successful 2021 Investor Day, we revealed our roadmap for the future of the open internet and unveiled our new Criteo branding to align with our significant transformation executed over the last year, including a new logo, visual identity and brand positioning, “The Future is Wide Open”.
___________________________________________________
1 Revenue excluding Traffic Acquisition Costs, or Revenue ex-TAC, Revenue ex-TAC margin, Adjusted EBITDA, Adjusted EBITDA at constant currency, Adjusted EBITDA margin, Adjusted diluted EPS, Free Cash Flow and growth at constant currency are not measures calculated in accordance with U.S. GAAP.
2 Constant currency measures exclude the impact of foreign currency fluctuations and is computed by applying the 2020 average exchange rates for the relevant period to 2021 figures.
3 Same-client revenue or Revenue ex-TAC is the revenue or Revenue ex-TAC generated by clients that were live with us in a given quarter and still live with us the same quarter in the following year.
Financial Summary
Revenue for Q2 2021 was $551 million and Revenue ex-TAC was $220 million. Adjusted EBITDA for the quarter was $67 million, resulting in an adjusted diluted EPS of $0.63. At constant currency, Q2 2021 Revenue increased by 22% and Revenue ex-TAC increased by 18%. Free Cash Flow was $13 million in Q2 2021, growing 28% in the first half 2021 to $77 million, and driving a Free Cash Flow conversion rate of 54% of Adjusted EBITDA in the first half 2021. As of June 30, 2021, we had $553 million in cash and marketable securities on our balance sheet.
Sarah Glickman, Chief Financial Officer, said, “With strong double-digit growth in our new solutions, fast execution on our leading Commerce Media Platform and solid operating margins, we continue to invest in our sustainable and profitable growth.”
Revenue and Revenue ex-TAC
Revenue increased by 26% year-over-year in Q2 2021, or 22% at constant currency, to $551 million (Q2 2020: $438 million). Revenue ex-TAC in the quarter increased 22% year-over-year, or 18% at constant currency, to $220 million (Q2 2020: $180 million). Revenue ex-TAC as a percentage of revenue, or Revenue ex-TAC margin, was 40% (Q2 2020: 41%).
- Marketing Solutions revenue grew 28% (or 23% at constant currency) and Marketing Solutions revenue ex-TAC grew 19% (or 15% at constant currency), driven by increased spend from Retail clients, both on our retargeting and audience targeting solutions, offsetting part of the negative impact from continued lower spend from Travel clients.
- Retail Media revenue grew 13% (or 10% at constant currency) and Retail Media revenue ex-TAC increased 53% (or 49% on a constant currency basis), driven by good execution around Prime Day in North America and continued traction in EMEA.
- In the Americas, Revenue increased 19% year-over-year, or 19% at constant currency, to $221 million and represented 40% of total Revenue. Revenue ex-TAC increased 24% year-over-year, or 23% at constant currency, to $87 million and represented 40% of total Revenue ex-TAC.
- In EMEA, Revenue increased 31% year-over-year, or 21% at constant currency, to $209 million and represented 38% of total Revenue. Revenue ex-TAC increased 22% year-over-year, or 13% at constant currency, to $85 million and represented 38% of total Revenue ex-TAC.
- In Asia-Pacific, Revenue increased 31% year-over-year, or 29% at constant currency, to $121 million and represented 22% of total Revenue. Revenue ex-TAC increased 22% year-over-year, or 20% at constant currency, to $49 million and represented 22% of total Revenue ex-TAC.
Net Income and Adjusted Net Income
Net income grew 144% to $15 million in Q2 2021 (Q2 2020: $6 million). Net income margin as a percentage of revenue was 3% (Q2 2020: 1%). In the quarter, we incurred $10 million in restructuring related and transformation costs. Net income available to shareholders of Criteo S.A. was $15 million, or $0.23 per share on a diluted basis (Q2 2020: $6 million, or $0.09 per share on a diluted basis).
Adjusted Net Income, or net income adjusted to eliminate the impact of equity awards compensation expense, amortization of acquisition-related intangible assets, acquisition-related costs, restructuring related and transformation costs and the tax impact of these adjustments, was $41 million, or $0.63 per share on a diluted basis (Q2 2020: $17 million, or $0.27 per share on a diluted basis).
Adjusted EBITDA and Operating Expenses
Adjusted EBITDA increased 73% year-over-year, or 61% at constant currency, to $67 million (Q2 2020: $39 million), driven by the Revenue ex-TAC performance over the period and effective cost management balanced with growth investments. Adjusted EBITDA as a percentage of Revenue ex-TAC, or Adjusted EBITDA margin, was 31% (Q2 2020: 22%).
Operating expenses increased by 20% or $27 million, to $163 million (Q2 2020: $136 million), mostly driven by investments in our growth areas, including R&D, in a context of disciplined expense management. Operating expenses, excluding the impact of equity awards compensation expense, pension costs, acquisition-related costs, restructuring related and transformation costs, and depreciation and amortization, which we refer to as Non-GAAP Operating Expenses, increased by 9% or $11 million, to $131 million (Q2 2020: $120 million), driven by investments in our growth areas, including R&D, and the impact of our growing stock price on our social charges over the period.
Cash Flow, Cash and Financial Liquidity Position
Cash flow from operating activities decreased 21% year-over-year to $26 million in Q2 2021 (Q2 2020: $33 million) and grew 15% to $104 million in the first half 2021 (H1 2020: $90 million).
Free Cash Flow, defined as cash flow from operating activities less acquisition of intangible assets, property, plant and equipment and change in accounts payable related to intangible assets, property, plant and equipment, decreased 11% to $13 million (Q2 2020: $15 million), but grew 28% in the first half 2021 to $77 million (H1 2020: $60 million), driving a Free Cash Flow conversion rate of 54% of Adjusted EBITDA in the first half 2021 (H1 2020: 61%).
In Q2 2021, we acquired Mabaya, expanding our Commerce Media Platform into the exciting area of online marketplaces. Cash and cash equivalents increased $2 million compared to December 31, 2020 to $490 million, after the Mabaya acquisition and spending $30 million on share repurchases in the second quarter of 2021.
As of June 30, 2021, the Company had total financial liquidity in excess of $1 billion, including its cash position, marketable securities, Revolving Credit Facility and treasury shares reserved for M&A.
Business Outlook
The following forward-looking statements reflect Criteo’s expectations as of August 4, 2021.
Fiscal year 2021 guidance:
- We raise our Revenue ex-TAC growth outlook to between +6% and +8% at constant-currency.
- We raise our expectation of our Adjusted EBITDA margin to approximately 32% of Revenue ex-TAC.
Third quarter 2021 guidance:
- We expect Revenue ex-TAC between $202 million and $205 million, translating into constant-currency growth between +8% and +9% year-over-year.
- We expect Adjusted EBITDA between $47 million and $50 million.
The above guidance for the third quarter and the fiscal year ending December 31, 2021 assumes the following exchange rates for the main currencies impacting our business: a U.S. dollar-euro rate of 0.831, a U.S. dollar-Japanese Yen rate of 108, a U.S. dollar-British pound rate of 0.719, a U.S. dollar-Korean Won rate of 1,112 and a U.S. dollar-Brazilian real rate of 5.36.
The above guidance assumes no acquisitions are completed during the third quarter ending September 30, 2021 and fiscal year ended December 31, 2021.
Reconciliation of Revenue ex-TAC and Adjusted EBITDA guidance to the closest corresponding U.S. GAAP measure is not available without unreasonable efforts on a forward-looking basis due to the high variability, complexity and low visibility with respect to the charges excluded from these non-GAAP measures; in particular, the measures and effects of equity awards compensation expense specific to equity compensation awards that are directly impacted by unpredictable fluctuations in our share price. The variability of the above charges could potentially have a significant impact on our future U.S. GAAP financial results.
Non-GAAP Financial Measures
This press release and its attachments include the following financial measures defined as non-GAAP financial measures by the U.S. Securities and Exchange Commission (“SEC”): Revenue ex-TAC, Revenue ex-TAC by Region, Revenue ex-TAC by Solution, Revenue ex-TAC margin, Adjusted EBITDA, Adjusted EBITDA margin, Adjusted Net Income, Adjusted diluted EPS, Free Cash Flow and Non-GAAP Operating Expenses. These measures are not calculated in accordance with U.S. GAAP.
Revenue ex-TAC is our revenue excluding Traffic Acquisition Costs (“TAC”) generated over the applicable measurement period and Revenue ex-TAC by Region reflects our Revenue ex-TAC by our geographies. Revenue ex-TAC, Revenue ex-TAC by Region, Revenue ex-TAC by Solution, and Revenue ex-TAC margin are key measures used by our management and board of directors to evaluate our operating performance, generate future operating plans and make strategic decisions regarding the allocation of capital. In particular, we believe that the elimination of TAC from revenue can provide a useful measure for period-to-period comparisons of our business and across our geographies.
Accordingly, we believe that Revenue ex-TAC, Revenue ex-TAC by Region, Revenue ex-TAC by Solution and Revenue ex-TAC margin provide useful information to investors and the market generally in understanding and evaluating our operating results in the same manner as our management and board of directors.
Adjusted EBITDA is our consolidated earnings before financial income (expense), income taxes, depreciation and amortization, adjusted to eliminate the impact of equity awards compensation expense, pension service costs and restructuring related and transformation costs.
Adjusted EBITDA and Adjusted EBITDA margin are key measures used by our management and board of directors to understand and evaluate our core operating performance and trends, to prepare and approve our annual budget and to develop short- and long-term operational plans. In particular, we believe that by eliminating equity awards compensation expense, pension service costs and restructuring related and transformation costs, Adjusted EBITDA and Adjusted EBITDA margin can provide useful measures for period-to-period comparisons of our business. Accordingly, we believe that Adjusted EBITDA and Adjusted EBITDA margin provide useful information to investors and the market generally in understanding and evaluating our results of operations in the same manner as our management and board of directors.
Adjusted Net Income is our net income adjusted to eliminate the impact of equity awards compensation expense, amortization of acquisition-related intangible assets, restructuring related and transformation costs and the tax impact of these adjustments. Adjusted Net Income and Adjusted diluted EPS are key measures used by our management and board of directors to evaluate operating performance, generate future operating plans and make strategic decisions regarding the allocation of capital.
In particular, we believe that by eliminating equity awards compensation expense, amortization of acquisition-related intangible assets, restructuring related and transformation costs and the tax impact of these adjustments, Adjusted Net Income and Adjusted diluted EPS can provide useful measures for period-to-period comparisons of our business. Accordingly, we believe that Adjusted Net Income and Adjusted diluted EPS provide useful information to investors and the market generally in understanding and evaluating our results of operations in the same manner as our management and board of directors.
Free Cash Flow is defined as cash flow from operating activities less acquisition of intangible assets, property, plant and equipment and change in accounts payable related to intangible assets, property, plant and equipment. Free Cash Flow Conversion is defined as free cash flow divided by Adjusted EBITDA. Free Cash Flow and Free Cash Flow Conversion are key measures used by our management and board of directors to evaluate the Company’s ability to generate cash. Accordingly, we believe that Free Cash Flow and Free Cash Flow Conversion permit a more complete and comprehensive analysis of our available cash flows.
Non-GAAP Operating Expenses are our consolidated operating expenses adjusted to eliminate the impact of depreciation and amortization, equity awards compensation expense, pension service costs, and restructuring related and transformation costs. The Company uses Non-GAAP Operating Expenses to understand and compare operating results across accounting periods, for internal budgeting and forecasting purposes, for short-term and long-term operational plans, and to assess and measure our financial performance and the ability of our operations to generate cash. We believe Non-GAAP Operating Expenses reflects our ongoing operating expenses in a manner that allows for meaningful period-to-period comparisons and analysis of trends in our business. As a result, we believe that Non-GAAP Operating Expenses provides useful information to investors in understanding and evaluating our core operating performance and trends in the same manner as our management and in comparing financial results across periods. In addition, Non-GAAP Operating Expenses is a key component in calculating Adjusted EBITDA, which is one of the key measures the Company uses to provide its quarterly and annual business outlook to the investment community.
Please refer to the supplemental financial tables provided in the appendix of this press release for a reconciliation of Revenue ex-TAC to revenue, Revenue ex-TAC by Region to revenue by region, Revenue ex-TAC by Solution to revenue by solution, Adjusted EBITDA to net income, Adjusted Net Income to net income, Free Cash Flow to cash flow from operating activities, and Non-GAAP Operating Expenses to operating expenses, in each case, the most comparable U.S. GAAP measure. Our use of non-GAAP financial measures has limitations as an analytical tool, and you should not consider such non-GAAP measures in isolation or as a substitute for analysis of our financial results as reported under U.S. GAAP. Some of these limitations are: 1) other companies, including companies in our industry which have similar business arrangements, may address the impact of TAC differently; and 2) other companies may report Revenue ex-TAC, Revenue ex-TAC by Region, Revenue ex-TAC by Solution, Adjusted EBITDA, Adjusted Net Income, Free Cash Flow, Non-GAAP Operating Expenses or similarly titled measures but calculate them differently or over different regions, which reduces their usefulness as comparative measures. Because of these and other limitations, you should consider these measures alongside our U.S. GAAP financial results, including revenue and net income.
Forward-Looking Statements Disclosure
This press release contains forward-looking statements, including projected financial results for the quarter ending June 30, 2021 and the year ended December 31, 2021, our expectations regarding our market opportunity and future growth prospects and other statements that are not historical facts and involve risks and uncertainties that could cause actual results to differ materially. Factors that might cause or contribute to such differences include, but are not limited to: failure related to our technology and our ability to innovate and respond to changes in technology, uncertainty regarding the scope and impact of the COVID-19 pandemic on our employees, operations, revenue and cash flows, uncertainty regarding our ability to access a consistent supply of internet display advertising inventory and expand access to such inventory, including without limitation uncertainty regarding the timing and scope of proposed changes to and enhancements of the Chrome browser announced by Google, investments in new business opportunities and the timing of these investments, whether the projected benefits of acquisitions materialize as expected, uncertainty regarding international growth and expansion, the impact of competition, uncertainty regarding legislative, regulatory or self-regulatory developments regarding data privacy matters and the impact of efforts by other participants in our industry to comply therewith, the impact of consumer resistance to the collection and sharing of data, our ability to access data through third parties, failure to enhance our brand cost-effectively, recent growth rates not being indicative of future growth, our ability to manage growth, potential fluctuations in operating results, our ability to grow our base of clients, and the financial impact of maximizing Revenue ex-TAC, as well as risks related to future opportunities and plans, including the uncertainty of expected future financial performance and results and those risks detailed from time-to-time under the caption “Risk Factors” and elsewhere in the Company’s SEC filings and reports, including the Company’s Annual Report on Form 10-K filed with the SEC on February 26, 2021, and in subsequent Quarterly Reports on Form 10-Q as well as future filings and reports by the Company. Importantly, at this time, the COVID-19 pandemic continues to have a significant impact on Criteo’s business, financial condition, cash flow and results of operations. There are significant uncertainties about the duration and the extent of the impact of the COVID-19 virus.
Except as required by law, the Company undertakes no duty or obligation to update any forward-looking statements contained in this release as a result of new information, future events, changes in expectations or otherwise.
Conference Call Information
Criteo’s senior management team will discuss the Company’s earnings on a call that will take place today, August 4, 2021, at 8:00 AM ET, 2:00 PM CET. The conference call will be webcast live at this link and will be available for replay on the Company’s website ir.criteo.com.
- S. callers: +1 855 209 8212
- International callers: +1 412 317 0788 or +33 1 76 74 05 02
Please ask to be joined into the “Criteo S.A.” call.
About Criteo
Criteo (NASDAQ: CRTO) is the global technology company that provides the world’s leading Commerce Media Platform. 2,500 Criteo team members partner with over 21,000 marketers and thousands of media owners around the globe to activate the world’s largest set of commerce data to drive better commerce outcomes. By powering trusted and impactful advertising, Criteo brings richer experiences to every consumer while supporting a fair and open internet that enables discovery, innovation and choice. For more information, please visit criteo.com.
Contacts
Criteo Investor Relations
Edouard Lassalle, SVP, Market Relations & Capital Markets, e.lassalle@criteo.com
Clemence Vermersch, Director, Investor Relations, c.vermersch@criteo.com
Criteo Public Relations
Jessica Meyers, Director, Public Relations, Americas, j.meyers@criteo.com
Download the PDF for financial information