Q3 Activated Media Spend Up 32%
Launched Commerce Max DSP into General Availability
NEW YORK – November 2, 2023 – Criteo S.A. (NASDAQ: CRTO) (“Criteo” or the “Company”), the commerce media company, today announced financial results for the three and nine months ended September 30, 2023.
Third Quarter 2023 Financial Highlights:
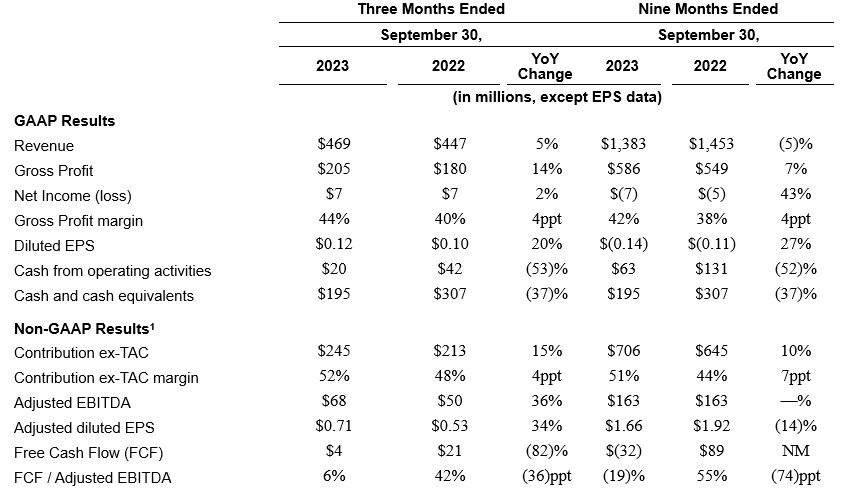
The following table summarizes our consolidated financial results for the three months and nine months ended September 30, 2023:
“We are pleased to report a strong third quarter marked by organic growth acceleration and market share gains in Retail Media. We continue to pivot our business towards areas of high growth, which represented more than half of our business for the first time ever this quarter,” said Megan Clarken, Chief Executive Officer of Criteo. “We have built the only unified, AI-driven platform that directly connects advertisers with retailers and publishers to drive commerce on retailers’ sites and the open internet, which, we believe, will drive long-term shareholder value.”
Operating Highlights
• We launched Commerce Max into general availability, a first-of-its-kind self-service demand-side platform (DSP) giving brands and agencies a single point of entry to retail media inventory onsite and across premium publishers offsite.
• We expanded our retailer monetization solution suite, Commerce Yield, offering retailers the means to tap previously unattainable demand by paving the way for the integration of marketplace and in-store monetization technologies.
• Criteo’s activated media spend2, including Iponweb, was $4.0 billion in the last 12 months and $1.0 billion in Q3, growing 32% year-over-year at constant currency3.
• Retail Media Contribution ex-TAC grew 29% year-over-year at constant currency3 and same-retailer Contribution ex-TAC4 retention for Retail Media was 123%.
• We expanded our platform adoption to 2,500 brands and 220 retailers, including Saks, DocMorris, and Mercatus.
• Marketing Solutions Contribution ex-TAC was up 1% year-over-year at constant currency3.
• We deployed $103 million of capital for share repurchases in the first nine months of 2023.
___________________________________________________
1 Contribution ex-TAC, Contribution ex-TAC margin, Adjusted EBITDA, Adjusted EBITDA margin, Adjusted diluted EPS and Free Cash Flow are not measures calculated in accordance with U.S. GAAP.
2 Activated media spend is defined as the sum of our Marketing Solutions revenue, the media spend activated on behalf of our Retail Media clients, and the media spend activated by Iponweb.
3 Constant currency measures exclude the impact of foreign currency fluctuations and is computed by applying the prior year monthly exchange rates to transactions denominated in settlement or billing currencies other than the US dollar.
4 Same-client profitability or Contribution ex-TAC is the profitability or Contribution ex-TAC generated by clients that were live with us in a given quarter and are still live with us the same quarter in the following year.
Financial Summary
Revenue for Q3 2023 was $469 million, gross profit was $205 million and Contribution ex-TAC was $245 million. Net income for Q3 was $7 million, or $0.12 per share on a diluted basis. Adjusted EBITDA for Q3 was $68 million, resulting in an adjusted diluted EPS of $0.71. As reported, revenue for Q3 increased by 5%, gross profit increased 14% and Contribution ex-TAC increased by 15%. At constant currency, revenue for Q3 increased by 2% and Contribution ex-TAC increased by 13%. Cash flow from operating activities was $20 million in Q3 and Free Cash Flow was $4 million in Q3. As of September 30, 2023, we had $232 million in cash and marketable securities on our balance sheet.
Sarah Glickman, Chief Financial Officer, said, “Our third quarter performance demonstrates our strong focus on execution and cost discipline. Despite a challenging macro environment, we believe we are well on our way to achieving over $1 billion in Contribution ex-TAC this year for the first time in Criteo’s history.”
Third Quarter 2023 Results
Revenue, Gross Profit and Contribution ex-TAC
Revenue increased by 5% year-over-year in Q3 2023, or 2% at constant currency, to $469 million (Q3 2022: $447 million). Gross profit increased by 14% year-over-year in Q3 2023 to $205 million (Q3 2022: $180 million). Gross profit as a percentage of revenue, or gross profit margin, was 44% (Q3 2022: 40%). Contribution ex-TAC in the third quarter increased 15% year-over-year, or increased 13% at constant currency, to $245 million (Q3 2022: $213 million). Contribution ex-TAC as a percentage of revenue, or Contribution ex-TAC margin, was 52% (Q3 2022: 48%), up 400 basis points year-over-year, largely driven by Retail Media and our client transition to the Company’s platform.
• Marketing Solutions revenue was flat, or decreased 4% at constant currency, and Marketing Solutions Contribution ex-TAC increased 3%, or increased 1% at constant currency, driven by the continued traction of Commerce Audiences as more clients adopt full funnel activation.
• Retail Media revenue increased 21%, or 19% at constant currency, reflecting continued strength in Retail Media onsite, partially offset by the impact related to the client migration to the Company’s platform. Retail Media Contribution ex-TAC increased 31%, or 29% at constant currency, driven by continued strength in Retail Media onsite, new client integrations and growing network effects of the platform.
• Iponweb revenue increased 82%, or 79% on constant currency basis, to $34 million following the closing of the acquisition on August 1, 2022.
Net Income (Loss) and Adjusted Net Income
Net income was $7 million in Q3 2023 (Q3 2022: net income of $7 million). Net income allocated to shareholders of Criteo was $7 million, or $0.12 per share on a diluted basis (Q3 2022: net income available to shareholders of $7 million, or $0.10 per share on a diluted basis).
Adjusted net income, a non-GAAP financial measure, was $43 million, or $0.71 per share on a diluted basis (Q3 2022: $33 million, or $0.53 per share on a diluted basis).
Adjusted EBITDA and Operating Expenses
Adjusted EBITDA was $68 million, representing an increase of 36% year-over-year (Q3 2022: $50 million). This reflects higher Contribution ex-TAC over the period and planned cost reduction actions, partially offset by incremental costs following the acquisition of Iponweb. Adjusted EBITDA as a percentage of Contribution ex-TAC, or Adjusted EBITDA margin, was 28% (Q3 2022: 24%).
Operating expenses increased by 11% year-over-year to $194 million (Q3 2022: $175 million), mostly driven by equity awards compensation expense and operating costs from Iponweb, partially offset by cost reduction actions. Non-GAAP operating expenses increased by 5% to $148 million (Q3 2022: $141 million).
Cash Flow, Cash and Financial Liquidity Position
Cash flow from operating activities decreased to $20 million in Q3 2023 (Q3 2022: $42 million).
Free Cash Flow, defined as cash flow from operating activities less acquisition of intangible assets, property, plant and equipment and change in accounts payable related to intangible assets, property, plant and equipment, decreased to $4 million in Q3 2023 (Q3 2022: $21 million). This was mainly driven by the CNIL payment of $43 million in Q3 2023.
Cash and cash equivalents, and marketable securities, decreased $141 million compared to December 31, 2022 to $232 million, after spending $103 million on share repurchases in the first nine months of 2023.
As of September 30, 2023, the Company had total financial liquidity of approximately $747 million, including its cash position, marketable securities, revolving credit facility and treasury shares reserved for M&A.
2023 Business Outlook
The following forward-looking statements reflect Criteo’s expectations as of November 2, 2023, amidst an uncertain macro-economic and geopolitical backdrop.
Fiscal year 2023 guidance:
• +9% to +10% growth in Contribution ex-TAC at constant currency, including the contribution from our Iponweb acquisition
• Adjusted EBITDA margin of approximately 27% to 28% of Contribution ex-TAC, reflecting the flow-through of our refined Contribution ex-TAC projections and incremental currency headwinds
Fourth quarter 2023 guidance:
• Contribution ex-TAC between $296 million and $302 million, or year-over-year growth at constant-currency of +5% to +7%
• Adjusted EBITDA between $109 million and $115 million
The above guidance for the fourth quarter and fiscal year ending December 31, 2023 assumes the following exchange rates for the main currencies impacting our business: a U.S. dollar-euro rate of 0.926, a U.S. dollar-Japanese Yen rate of 141, a U.S. dollar-British pound rate of 0.809, a U.S. dollar-Korean Won rate of 1,318 and a U.S. dollar-Brazilian real rate of 5.03.
The above guidance assumes that no additional acquisitions are completed during the fourth quarter of 2023 or the fiscal year ended December 31, 2023.
Reconciliations of Contribution ex-TAC, Adjusted EBITDA and Adjusted EBITDA margin guidance to the closest corresponding U.S. GAAP measures are not available without unreasonable efforts on a forward-looking basis due to the high variability, complexity and low visibility with respect to the charges excluded from these non-GAAP measures; in particular, the measures and effects of equity awards compensation expense specific to equity compensation awards that are directly impacted by unpredictable fluctuations in our share price. The variability of the above charges could potentially have a significant impact on our future U.S. GAAP financial results.
Non-GAAP Financial Measures
This press release and its attachments include the following financial measures defined as non-GAAP financial measures by the U.S. Securities and Exchange Commission (“SEC”): Contribution ex-TAC, Contribution ex-TAC margin, Adjusted EBITDA, Adjusted EBITDA margin, Adjusted Net Income, Adjusted diluted EPS, Free Cash Flow and Non-GAAP Operating Expenses. These measures are not calculated in accordance with U.S. GAAP.
Contribution ex-TAC is a profitability measure akin to gross profit. It is calculated by deducting traffic acquisition costs from revenue and reconciled to gross profit through the exclusion of other costs of revenue. Contribution ex-TAC is not a measure calculated in accordance with U.S. GAAP. We have included Contribution ex-TAC because it is a key measure used by our management and board of directors to evaluate operating performance, generate future operating plans and make strategic decisions. In particular, we believe that this measure can provide useful measures for period-to-period comparisons of our business. Accordingly, we believe that Contribution ex-TAC provides useful information to investors and others in understanding and evaluating our results of operations in the same manner as our management and board of directors.
Adjusted EBITDA is our consolidated earnings before financial income (expense), income taxes, depreciation and amortization, adjusted to eliminate the impact of equity awards compensation expense, pension service costs, certain restructuring, integration and transformation costs, certain acquisition costs and a loss contingency related to a regulatory matter. Adjusted EBITDA and Adjusted EBITDA margin are key measures used by our management and board of directors to understand and evaluate our core operating performance and trends, to prepare and approve our annual budget and to develop short- and long-term operational plans. In particular, we believe that Adjusted EBITDA and Adjusted EBITDA margin can provide useful measures for period-to-period comparisons of our business. Accordingly, we believe that Adjusted EBITDA and Adjusted EBITDA margin provide useful information to investors and the market generally in understanding and evaluating our results of operations in the same manner as our management and board of directors.
Adjusted Net Income is our net income adjusted to eliminate the impact of equity awards compensation expense, amortization of acquisition-related assets, certain restructuring, integration and transformation costs, certain acquisition costs, a loss contingency related to a regulatory matter, and the tax impact of these adjustments. Adjusted Net Income and Adjusted diluted EPS are key measures used by our management and board of directors to evaluate operating performance, generate future operating plans and make strategic decisions regarding the allocation of capital. In particular, we believe that Adjusted Net Income and Adjusted diluted EPS can provide useful measures for period-to-period comparisons of our business. Accordingly, we believe that Adjusted Net Income and Adjusted diluted EPS provide useful information to investors and the market generally in understanding and evaluating our results of operations in the same manner as our management and board of directors.
Free Cash Flow is defined as cash flow from operating activities less acquisition of intangible assets, property, plant and equipment and change in accounts payable related to intangible assets, property, plant and equipment. Free Cash Flow Conversion is defined as free cash flow divided by Adjusted EBITDA. Free Cash Flow and Free Cash Flow Conversion are key measures used by our management and board of directors to evaluate the Company’s ability to generate cash. Accordingly, we believe that Free Cash Flow and Free Cash Flow Conversion permit a more complete and comprehensive analysis of our available cash flows.
Non-GAAP Operating Expenses are our consolidated operating expenses adjusted to eliminate equity awards compensation expense, pension service costs, certain restructuring, integration and transformation costs, certain acquisition and integration costs, and a loss contingency related to a regulatory matter. The Company uses Non-GAAP Operating Expenses to understand and compare operating results across accounting periods, for internal budgeting and forecasting purposes, for short-term and long-term operational plans, and to assess and measure our financial performance and the ability of our operations to generate cash. We believe Non-GAAP Operating Expenses reflects our ongoing operating expenses in a manner that allows for meaningful period-to-period comparisons and analysis of trends in our business. As a result, we believe that Non-GAAP Operating Expenses provides useful information to investors in understanding and evaluating our core operating performance and trends in the same manner as our management and in comparing financial results across periods. In addition, Non-GAAP Operating Expenses is a key component in calculating Adjusted EBITDA, which is one of the key measures the Company uses to provide its quarterly and annual business outlook to the investment community.
Please refer to the supplemental financial tables provided in the appendix of this press release for a reconciliation of Contribution ex-TAC to gross profit, Adjusted EBITDA to net income, Adjusted Net Income to net income, Free Cash Flow to cash flow from operating activities, and Non-GAAP Operating Expenses to operating expenses, in each case, the most comparable U.S. GAAP measure. Our use of non-GAAP financial measures has limitations as an analytical tool, and you should not consider such non-GAAP measures in isolation or as a substitute for analysis of our financial results as reported under U.S. GAAP. Some of these limitations are: 1) other companies, including companies in our industry which have similar business arrangements, may address the impact of TAC differently; and 2) other companies may report Contribution ex-TAC, Contribution ex-TAC margin, Adjusted EBITDA, Adjusted Net Income, Free Cash Flow, Non-GAAP Operating Expenses or similarly titled measures but calculate them differently or over different regions, which reduces their usefulness as comparative measures. Because of these and other limitations, you should consider these measures alongside our U.S. GAAP financial results, including revenue and net income.
Forward-Looking Statements Disclosure
This press release contains forward-looking statements, including projected financial results for the quarter ending December 31, 2023 and the year ending December 31, 2023, our expectations regarding our market opportunity and future growth prospects and other statements that are not historical facts and involve risks and uncertainties that could cause actual results to differ materially. Factors that might cause or contribute to such differences include, but are not limited to: failure related to our technology and our ability to innovate and respond to changes in technology, uncertainty regarding our ability to access a consistent supply of internet display advertising inventory and expand access to such inventory, including without limitation uncertainty regarding the timing and scope of proposed changes to and enhancements of the Chrome browser announced by Google, investments in new business opportunities and the timing of these investments, whether the projected benefits of acquisitions materialize as expected, including the successful integration of our acquisitions of Iponweb and Brandcrush, uncertainty regarding international growth and expansion (including related to changes in a specific country’s or region’s political or economic conditions), the impact of competition, uncertainty regarding legislative, regulatory or self-regulatory developments regarding data privacy matters and the impact of efforts by other participants in our industry to comply therewith, the impact of consumer resistance to the collection and sharing of data, our ability to access data through third parties, failure to enhance our brand cost-effectively, recent growth rates not being indicative of future growth, our ability to manage growth, potential fluctuations in operating results, our ability to grow our base of clients, and the financial impact of maximizing Contribution ex-TAC, as well as risks related to future opportunities and plans, including the uncertainty of expected future financial performance and results and those risks detailed from time-to-time under the caption “Risk Factors” and elsewhere in the Company’s SEC filings and reports, including the Company’s Annual Report on Form 10-K filed with the SEC on February 24, 2023, and in subsequent Quarterly Reports on Form 10-Q as well as future filings and reports by the Company. Importantly, at this time, macro-economic conditions including inflation and rising interest rates in the U.S. have impacted Criteo’s business, financial condition, cash flow and results of operations.
Except as required by law, the Company undertakes no duty or obligation to update any forward-looking statements contained in this release as a result of new information, future events, changes in expectations or otherwise.
Conference Call Information
Criteo’s senior management team will discuss the Company’s earnings on a call that will take place today, November 2, 2023, at 8:00 AM ET, 1:00 PM CET. The conference call will be webcast live on the Company’s website at https://criteo.investorroom.com/ and will subsequently be available for replay.
• United States: +1 855 209 8212
• International: +1 412 317 0788
• France 080-510-2319
Please ask to be joined into the “Criteo” call.
About Criteo
Criteo (NASDAQ: CRTO) is the global commerce media company that enables marketers and media owners to drive better commerce outcomes. Its industry leading Commerce Media Platform connects thousands of marketers and media owners to deliver richer consumer experiences from product discovery to purchase. By powering trusted and impactful advertising, Criteo supports an open internet that encourages discovery, innovation, and choice. For more information, please visit www.criteo.com.
Contacts
Criteo Investor Relations
Melanie Dambre, m.dambre@criteo.com
Criteo Public Relations
Florian Herzing, f.herzing@criteo.com
Financial information to follow