People around the world across generations are consuming more video than they ever have, and they plan to watch even more going into 2022. While there are many factors driving up video consumption—including more time spent at home—one of the biggest factors at play is the rise of video streaming.
Consumers have their pick of dozens of video streaming services, both for free and with a paid subscription. In fact, according to PwC, video streaming revenue is forecast to grow 60% from 2020 to 2025 and reach $94 billion by the end of 2025, with most coming from subscription fees.1
Why are consumers investing more of their time and money in video streaming services? It’s a combination of convenience, choice, quality, originality, and price.
Criteo recently surveyed more than 9,000 video viewers globally to understand what, how, and why consumers watch in 2021 and beyond.
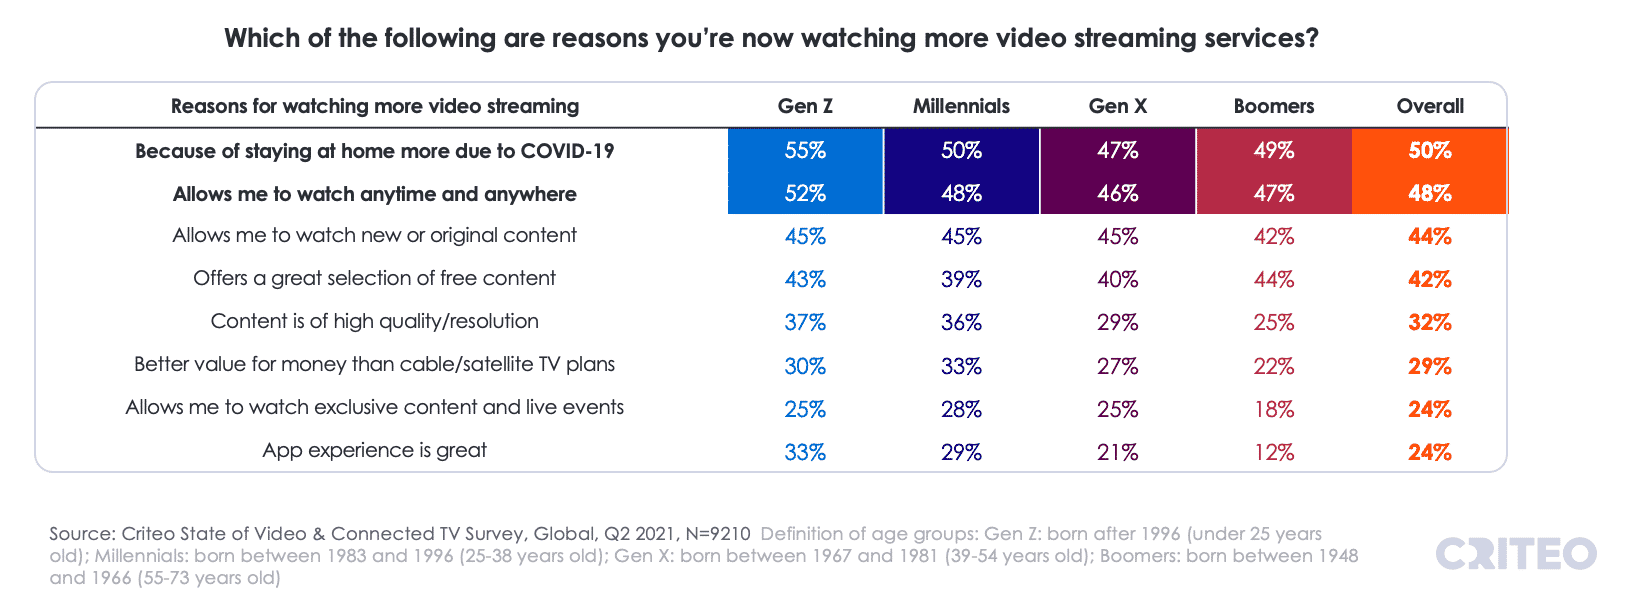
In addition to spending time at home, the flexibility of watching anytime and anywhere and the availability of new and original content are the top reasons for watching more streaming content. Two in 5 viewers enjoy the availability of free content, and 1 in 4 say streaming gets them a better value for their money than cable or satellite TV.
Read on to find out more video streaming trends from our global survey, including where consumers are spending their time within the world of streaming and when they’re most receptive to video advertising.
Video Streaming Glossary
Learn these key terms related to the survey and click here for our full Connected TV Glossary.
Connected TV (CTV): A device where ads are served within shows and movies that are streamed via over-the-top (OTT) services on any connected TV (televisions with a built-in internet connection) or streaming devices (like Apple TV, Amazon Firestick, or Roku).
Over the Top (OTT): Any video content “over the top of a cable box.” It is an umbrella term that includes both CTV and OLV advertising.
Online Video (OLV): A video ad format commonly referred to in reference to video advertising on web and mobile app devices (as opposed to connected TV devices).
Paid Video Streaming Services: Paid subscriptions used for accessing content from streaming companies or networks via the internet (like Netflix, Prime Video, Disney+, or Apple TV). May or may not include ads.
Internet TV Devices: A device that plugs into a non-smart TV to connect it to the internet (like Apple TV, Amazon Fire TV Stick, Google Chromecast, or Android TV Box) and gives access to streaming services.
Free Video Streaming Services: Free subscriptions used for accessing ad-supported content from streaming companies or networks via the internet (like Pluto TV, Amazon IMDb TV, or Facebook Watch).
Video Game Live Streaming: Live footage of gamers playing video games streamed to an online audience (like Amazon Twitch, Facebook Gaming, or YouTube).
Video Trend #1: Most consumers spend over 5 hours per week watching streaming content—and this will keep increasing.
Our global survey shows that video viewing of all types accelerated in 2020. Most people—3 out of 5—are watching more paid streaming services, and more than half are watching more free streaming services, video game live streaming, and social media videos.
Paid video streaming saw the highest viewing increases, with 3 out of 5 consumers saying they watch more paid streaming services such as Netflix, Prime Video, Disney+, and Apple TV.
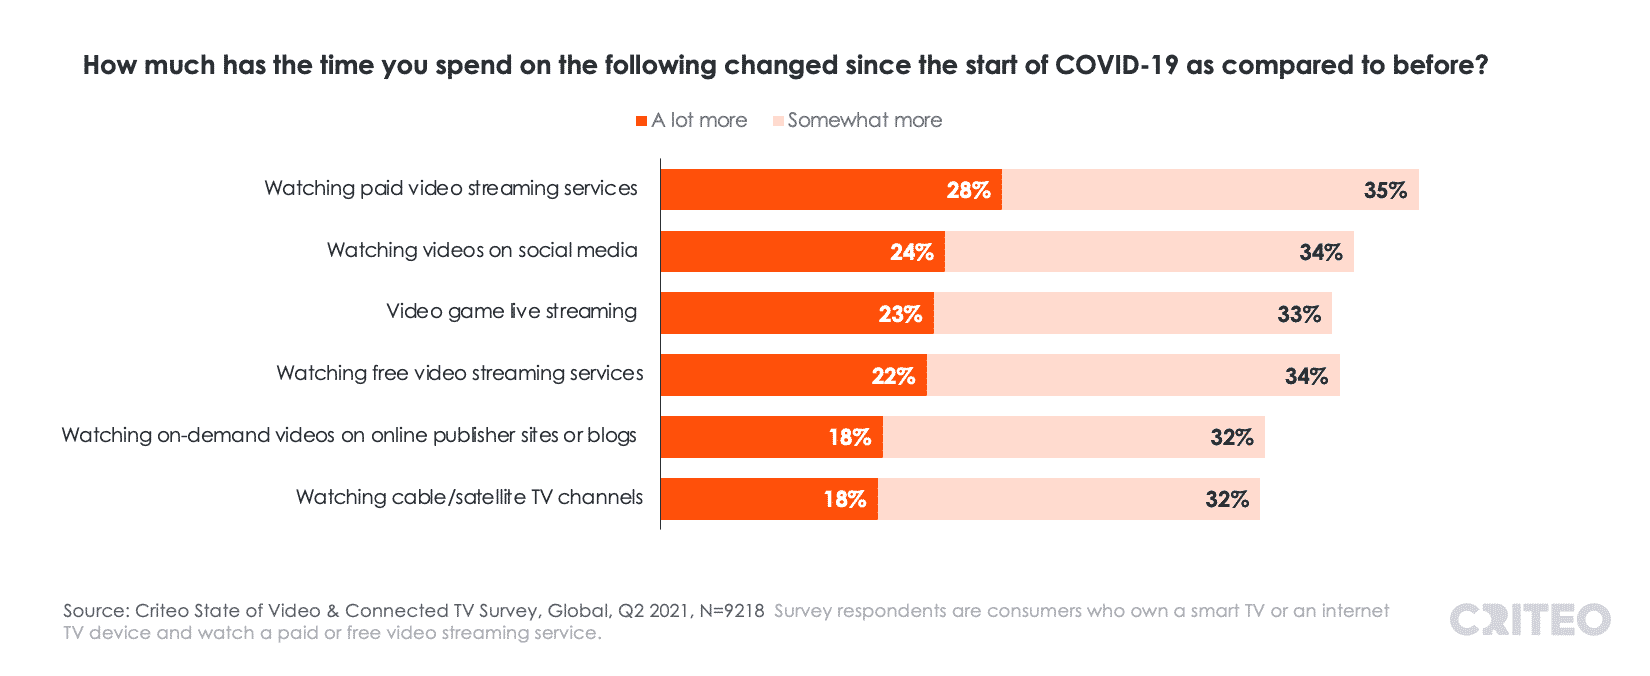
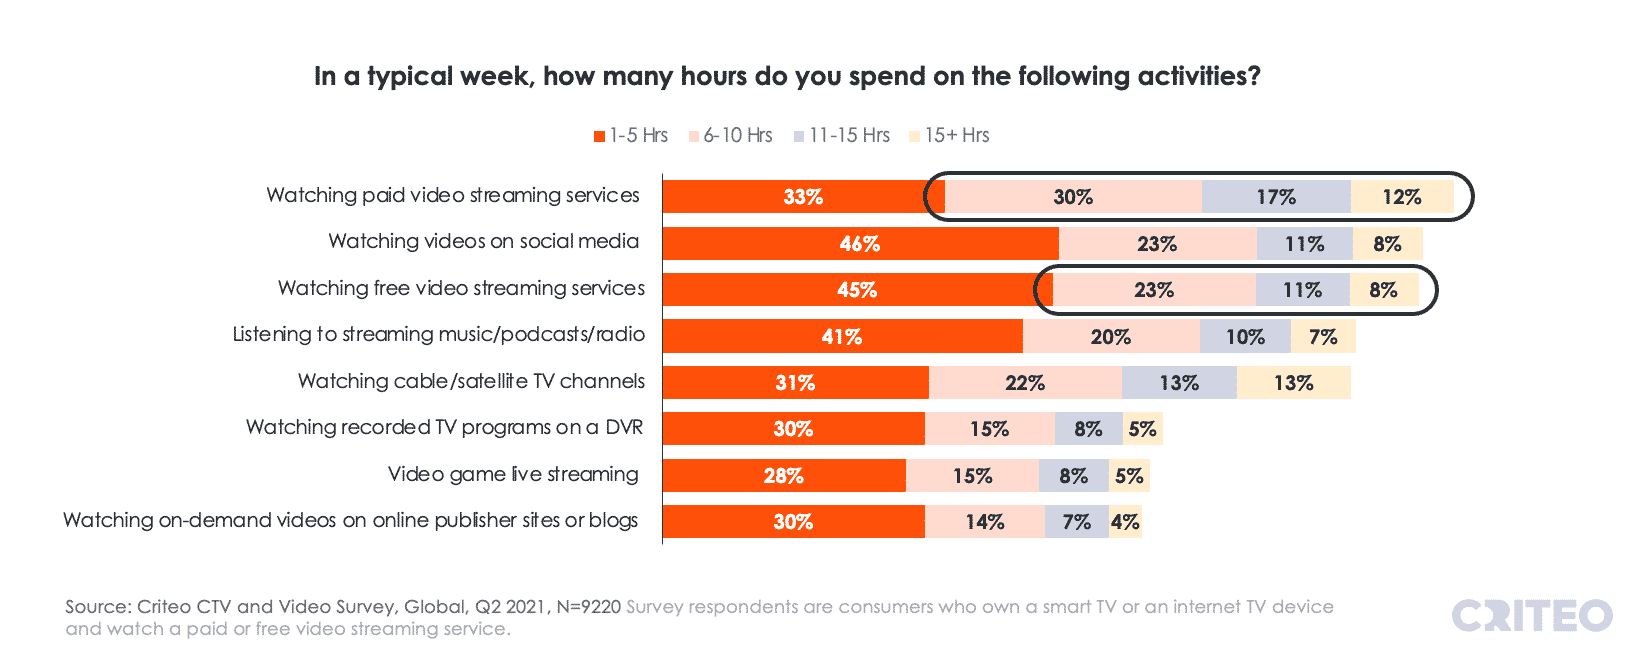
Consumers are spending the most time watching paid streaming services compared to other types of video content, but they’re also spending a significant number of hours watching free video content.
Two-thirds of our survey respondents say they spend more than 5 hours per week streaming paid video, while more than half spend over 5 hours watching free streaming content.
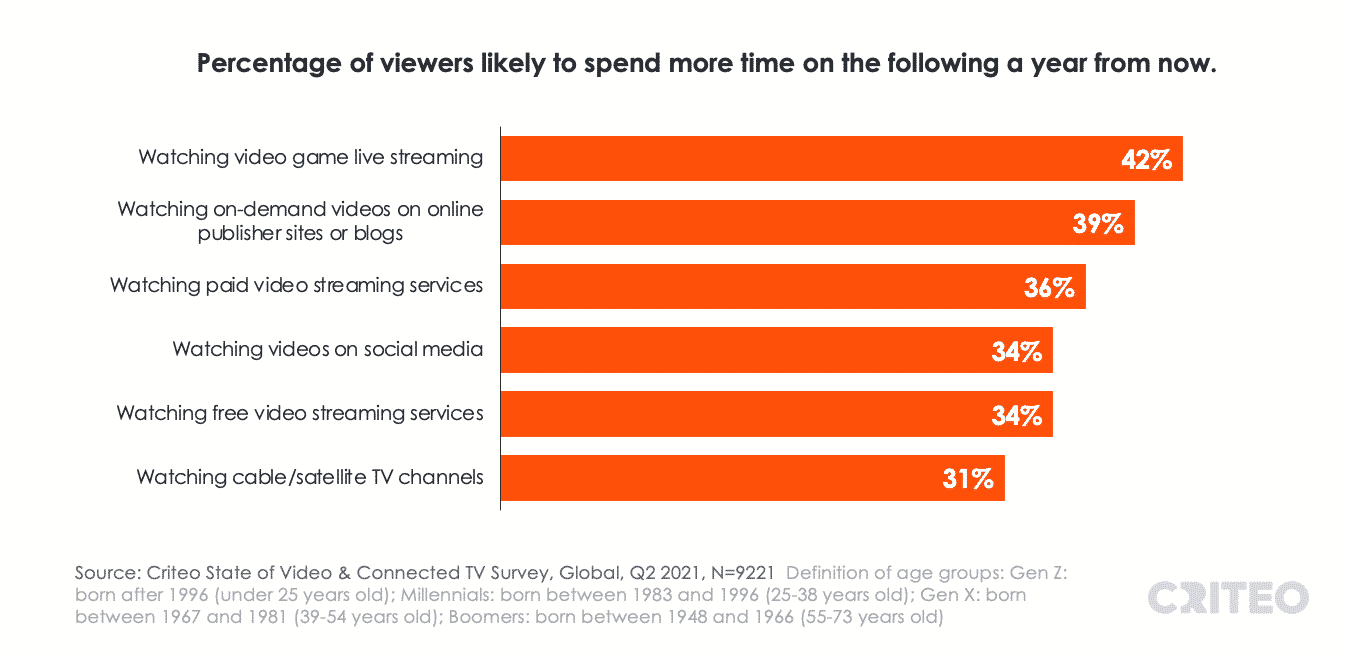
Even as people increase their away-from-home activities, they still expect to spend more time watching video content in the future. Our surveys found that one-third of consumers will watch more paid or free video streaming services in 2022.
Video Trend #2: More than half of consumers use video streaming services on their smartphone.
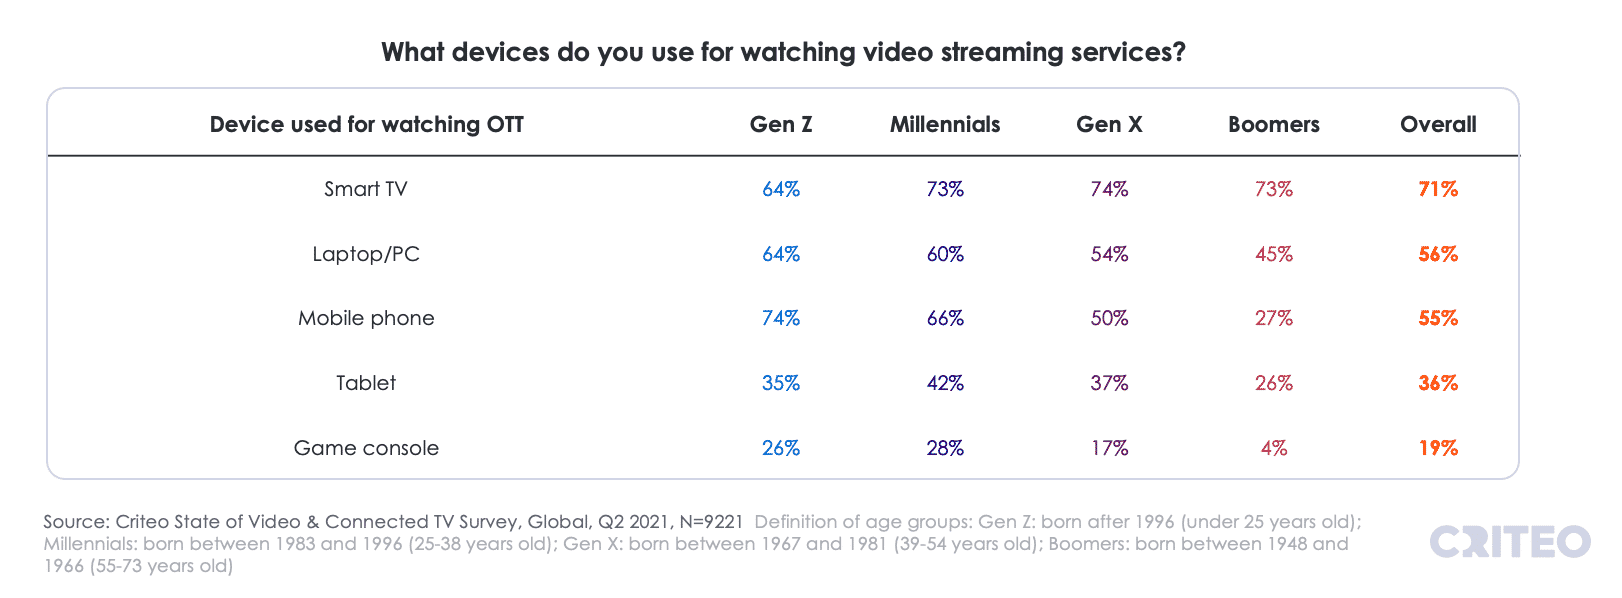
Though most consumers watch video streaming on their largest screen—their television—more than half use their laptop or smartphone to stream content.
Among the youngest viewers, mobile is the most popular device for video streaming. Three-fourths of Gen Z consumers watch video streaming on their smartphone, while nearly two-thirds use their computer or smart TV.
In every other generation, the smart TV is the most popular device for video streaming.
Video Trend #3: Consumers think streaming services offer better value and higher-quality content than cable.
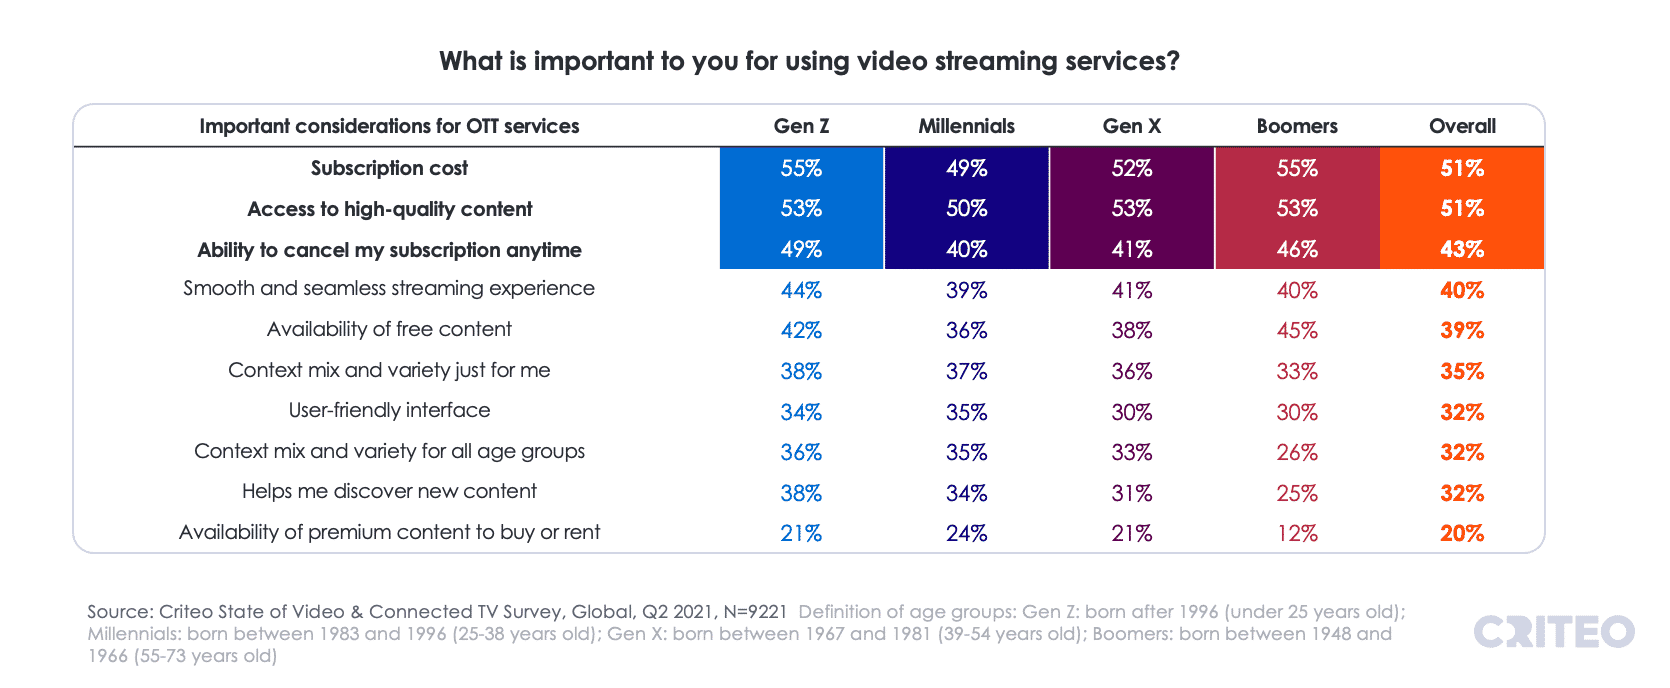
Across every generation, subscription cost and the quality of video content are the most important factors when consumers pick a streaming service. Other important attributes include the flexibility to cancel their subscription anytime and the availability of free content.
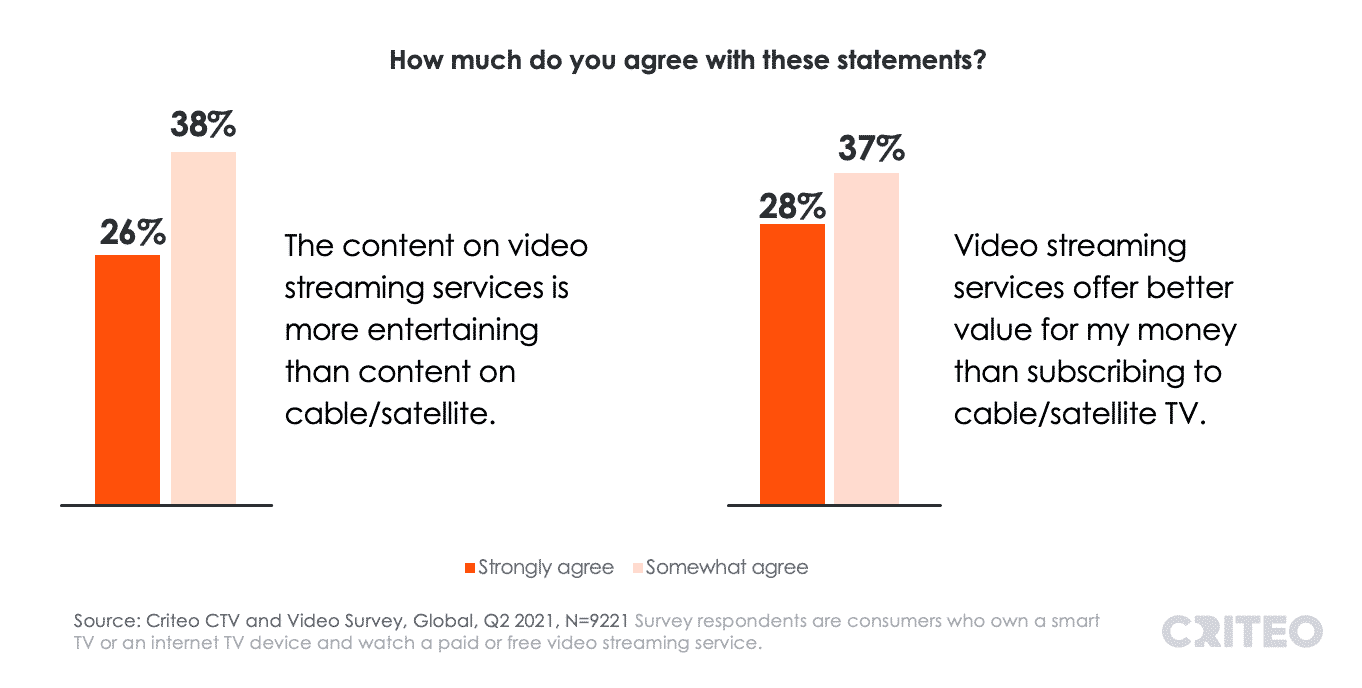
In addition, nearly 2 in 3 consumers say that the content on streaming services is more entertaining than cable or satellite TV. This same portion of viewers believes that streaming subscriptions offer better value for their money than subscribing to cable or satellite TV.
Video Trend #4: Consumers want access to live content for free.
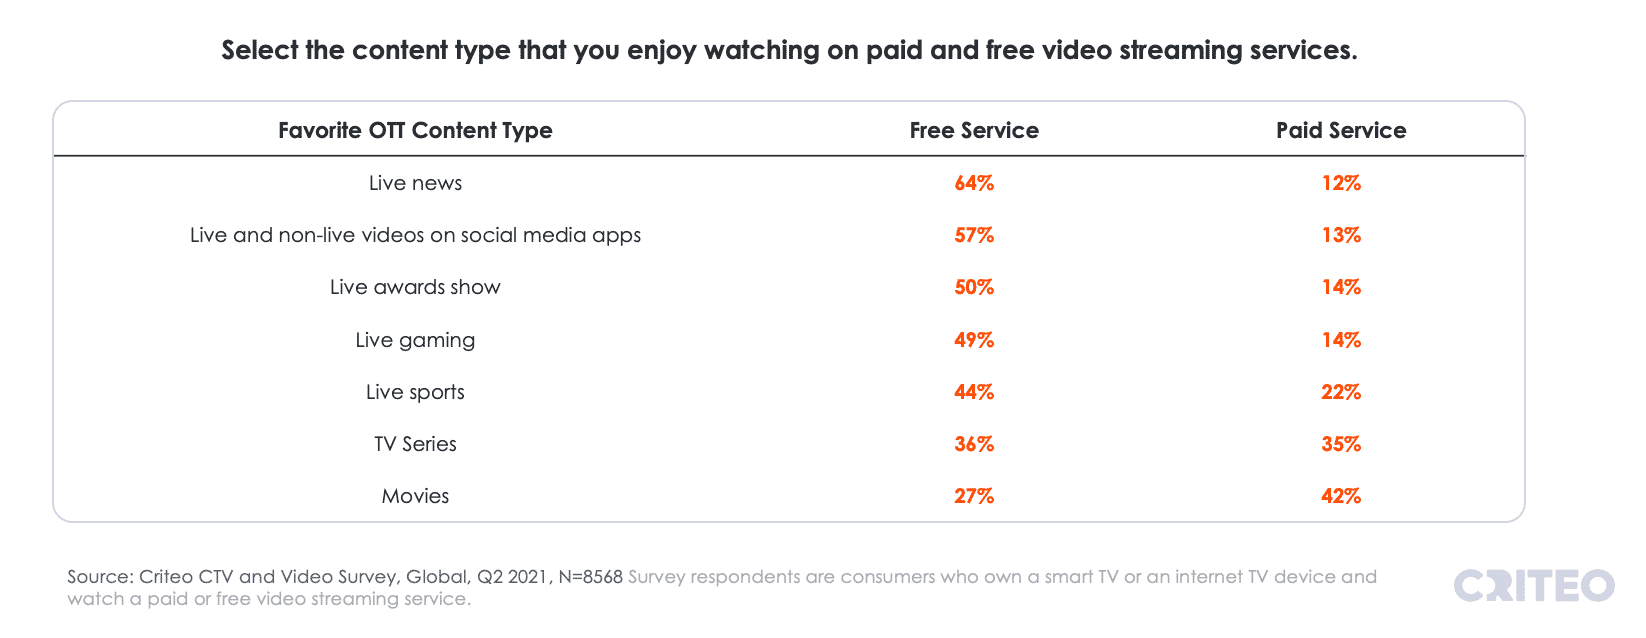
Our survey shows that there are some types of content that consumers will pay for, but most expect to get live content for free presumably with ads.
Consumers are most likely to pay to stream on-demand movies and TV shows. Meanwhile, two-thirds want to get live news for free, half want to watch live award shows and live gaming for free, and 2 in 5 want to see live sports for free.
Video Trend #5: Netflix is the most popular streaming service globally.
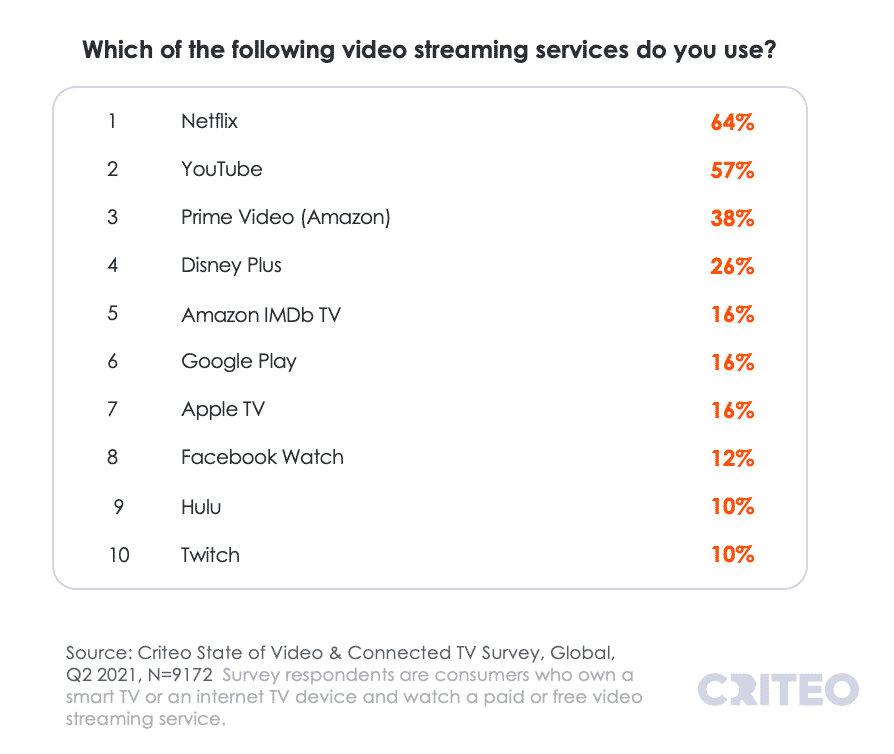
Across the world, Netflix is the most popular streaming service, followed by YouTube, Prime Video, and Disney+.
In the top 10 streaming services globally, there are a mix of paid subscription-based services, ad-supported services, and free on-demand video services—which gives marketers options when building an advertising strategy to reach highly engaged streaming viewers.
Video streaming is here to stay. Click here to start building your connected TV ad campaign. For more consumer trends, download our latest Shopper Story 2022 report and access more advertising strategies.
1Global Entertainment and Media Outlook 2021–2025, PwC.
2Criteo State of Video & Connected TV Survey, Global, Q2 2021, N=9,221. Survey respondents are consumers who own a smart TV or an internet TV device and watch a paid or free video streaming service.


