


Diwali, also known as the Festival of Lights, took place over five days in October, with the main day of feasting and fireworks occurring on October 24. Recognized as India’s most important celebration, Diwali symbolizes the triumph of lightness over dark, good over evil, and the promise of prosperity and good fortune.
It’s also one of the country’s largest shopping events, with consumers spending big on decorations, clothing, jewelry, gifts, sweets, lights, and fireworks to prepare for the festivities. After a few years of smaller celebrations due to the pandemic, predictions were for a more lavish Diwali in 2022, with pent-up demand driving consumers to spend more year over year.
Did results align with expectations? To understand what happened this Diwali, we analyzed over 20 million retail transactions during Diwali 2021 and 2022 across desktop, smartphones, and tablets. Here’s what we learned:
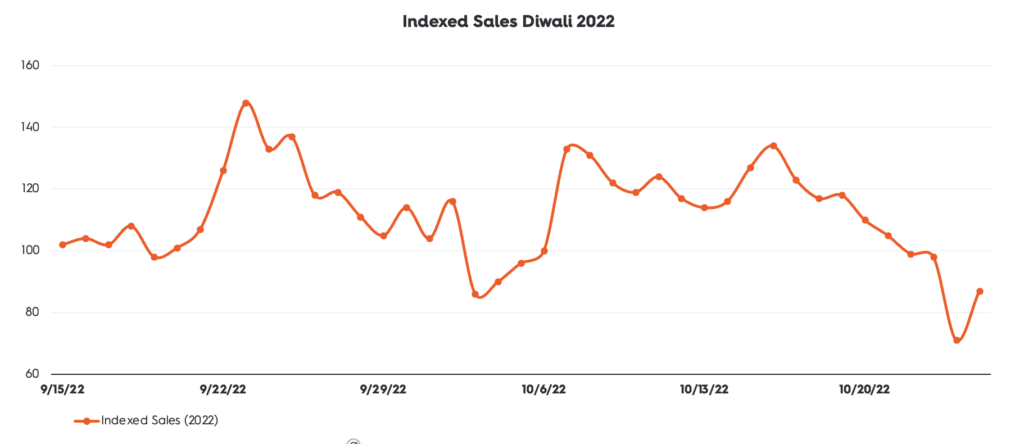
Online sales preceding Diwali increased more than 30% compared to early September
When compared to the first two weeks of September, online sales the week before Diwali peaked at +34% (sales drop significantly once Diwali starts, which is why we look at the week prior). The highest spike, however, was recorded on September 23, which corresponded with the beginning of festive season sales.
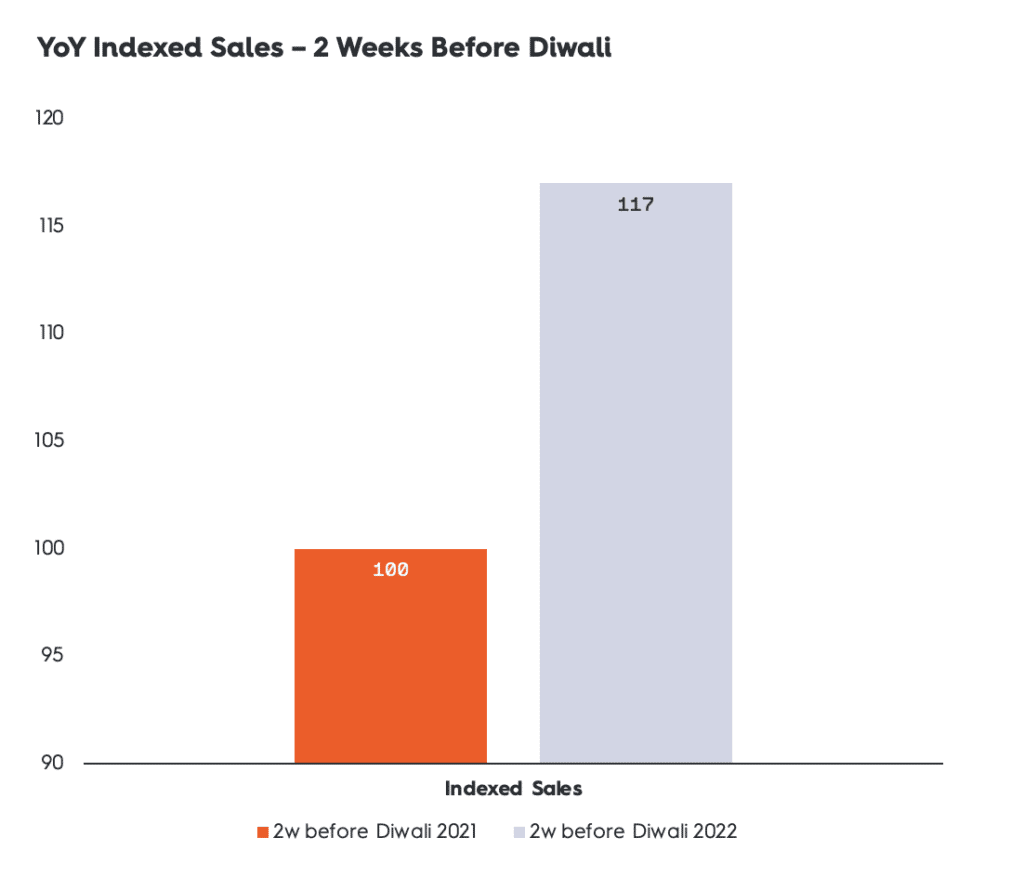
Year over year, online sales leading up to Diwali grew 17%
Predictions for a bigger Diwali this year were correct. Indians put their festive spirit and their generosity on display with more lights (the city of Ayodhya set a Guiness World Record with more than 1.5 million oil lamps!) and more purchases than in 2021.
In fact, our online sales data for the two-week period before Diwali (October 10-23) shows an increase of 17% versus the same two-week period last year (October 21-November 3).
Stuffed animals, phones, plants, and pants were big sellers
When we look at what product categories rose to the top, those with the highest average index for the week before Diwali were stuffed animals (+50%), mobile phones (+48%), pants (+35%), and indoor and outdoor plants (+34%). This is in line with the gifting, decorating, and dressing up that takes place during Diwali.
The verticals with the highest average index for the week before Diwali (compared to the first two weeks of September) included:
- Food & Beverages, with a +36% increase
- Arts & Entertainment, up +35%
- Furniture, +14%
Explore this data further in Criteo’s Commerce Trends Dashboard, embedded below.
For a guide on how to maximize your advertising for the peak shopping season, download our Holiday and Festive Season Playbook on a Page. Backed by Criteo data from more than 22,000 advertisers and $1 trillion in ecommerce sales, our playbook offers audience targeting strategies, ad format recommendations, messaging tactics, and more.