


With our network of more than 25,000 brands, retailers, and publishers, 4 billion product SKUs, and 2.5 billion active shoppers, Criteo is able to leverage the world’s largest commerce dataset to drive commerce outcomes across the open internet. In keeping with our belief that the #FutureIsWideOpen, we’re committed to making our commerce insights available to all.
The Criteo Commerce Trends Dashboard is an interactive tool that gives everyone the ability to view, analyze, compare, and contrast our commerce data. We built it to help marketers and media owners understand what’s happening in their market today and plan for tomorrow.
The dashboard includes year over year monthly sales trends data for 2020 and 2021, and daily sales trends data for 2021 to date. This commerce trends data is from 20 countries around the world and includes granular insights on 600 product categories and subcategories. Want to see sales data for apparel and accessories, specifically dresses, for this May compared to last May? We’ve got that. Interested in last week’s sales trends for the pasta and noodles subcategory? We have that, too.
For more on how to use the dashboard and examples of the commerce data you can see, read on.
Using the Criteo Commerce Trends Dashboard
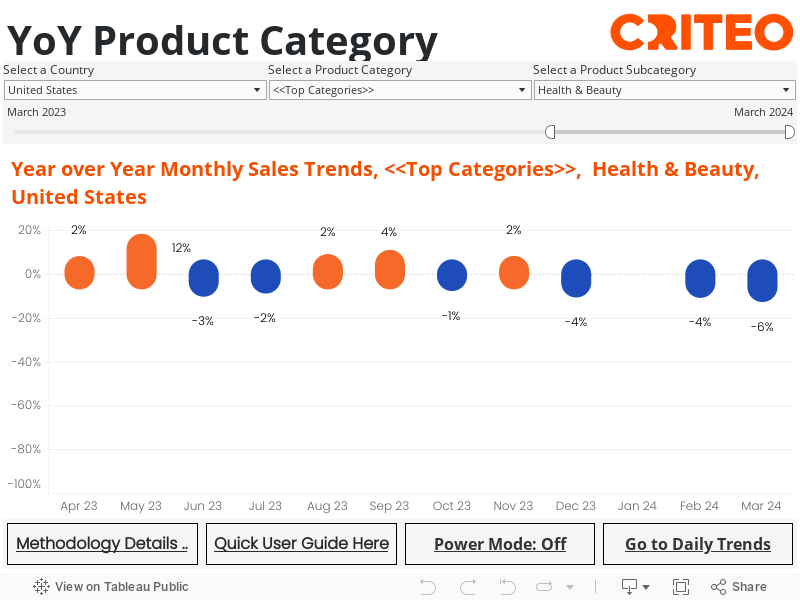
The YoY (Year Over Year) Monthly Trends view gives you an at-a-glance snapshot of how sales for specific product categories and subcategories have been trending. Simply select the Country, Product Category, and Product Subcategory using the dropdown menus to see the trends you’re interested in.
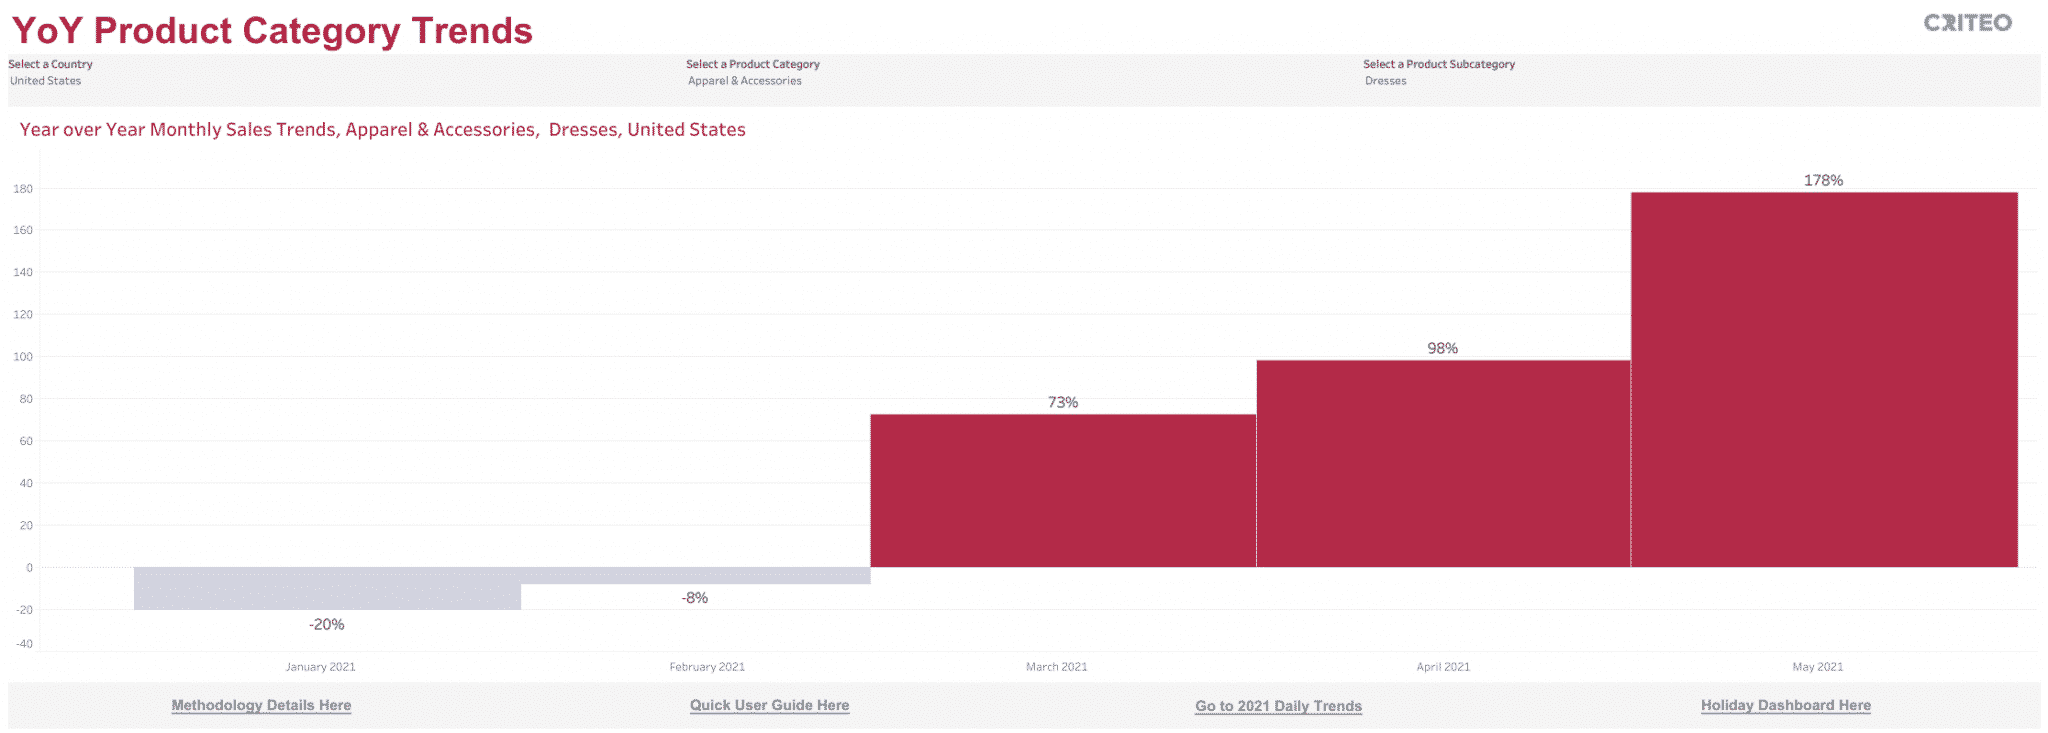
For example, in the chart below, we can see that in the US, the Dresses subcategory is experiencing massive growth, with sales up 178% in May 2021 vs. May 2020.
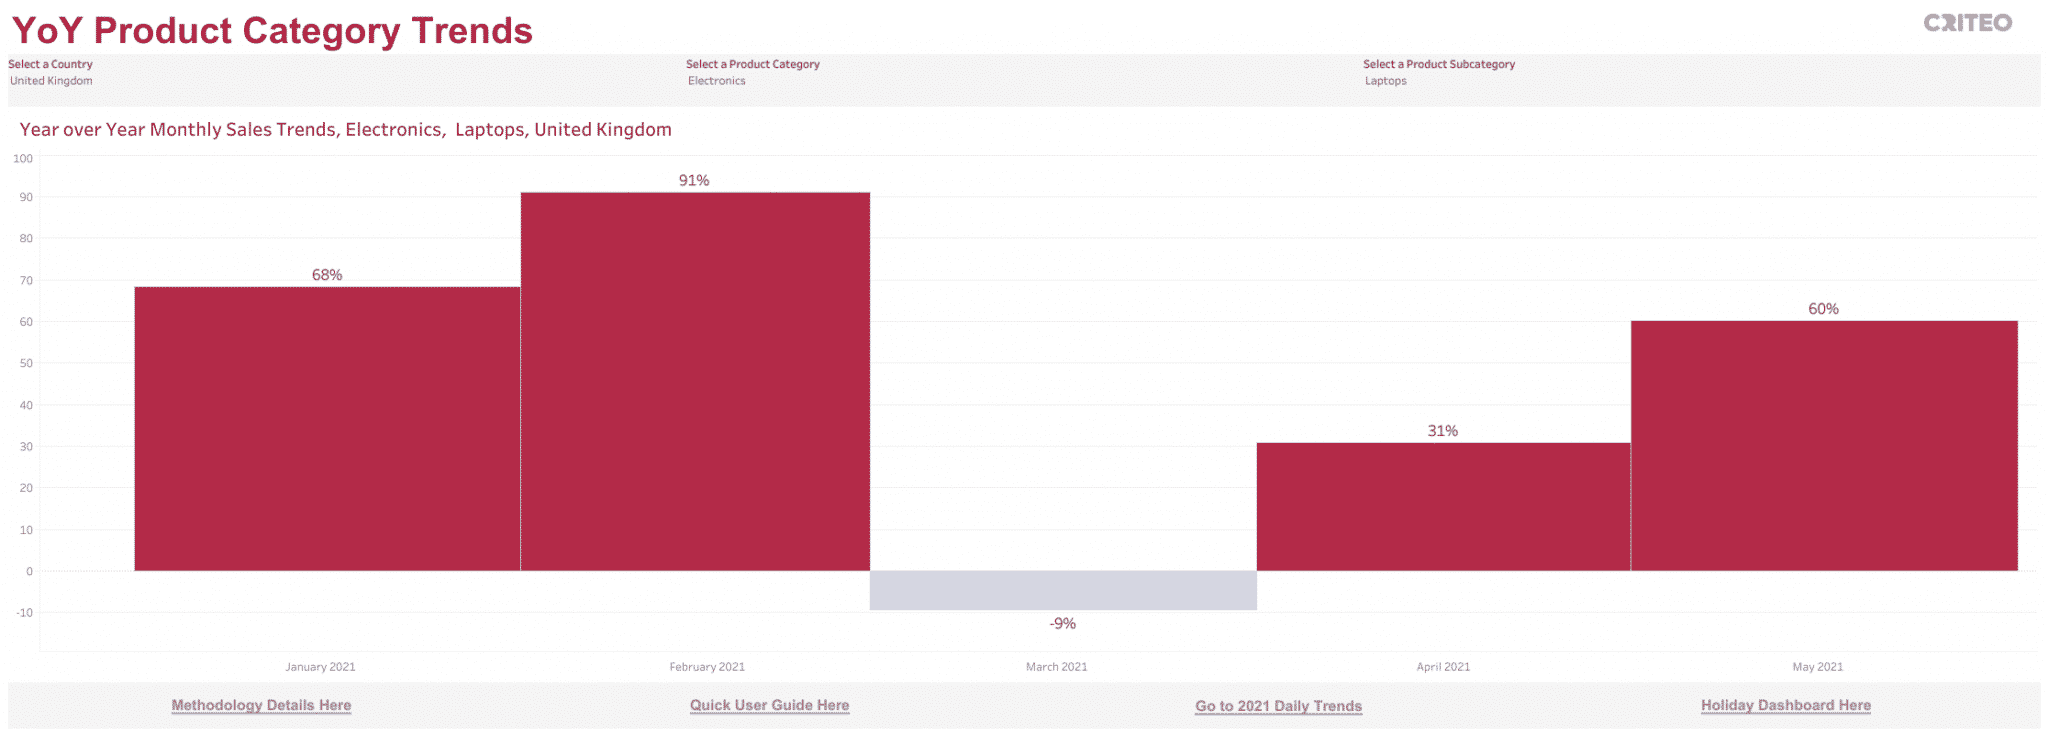
This chart shows that in the UK, laptop sales peaked in February, up 91% vs. last February, and climbed again from April to May.
The 2021 Daily Trends view provides more granularity, showing day-by-day, week-by-week trends to help marketers and media owners make immediate adjustments to campaigns and inventory. To use this tool, click on “Go to 2021 Daily Trends” in the bottom menu bar. Then, select the desired Country and Product Category. Use the slider to select the date range. To focus on a specific subcategory, click on it in the right-hand menu.
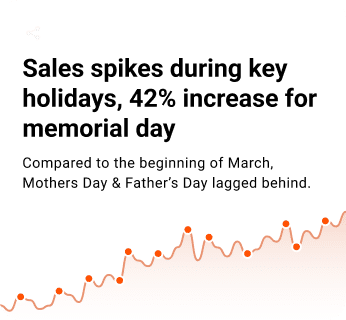
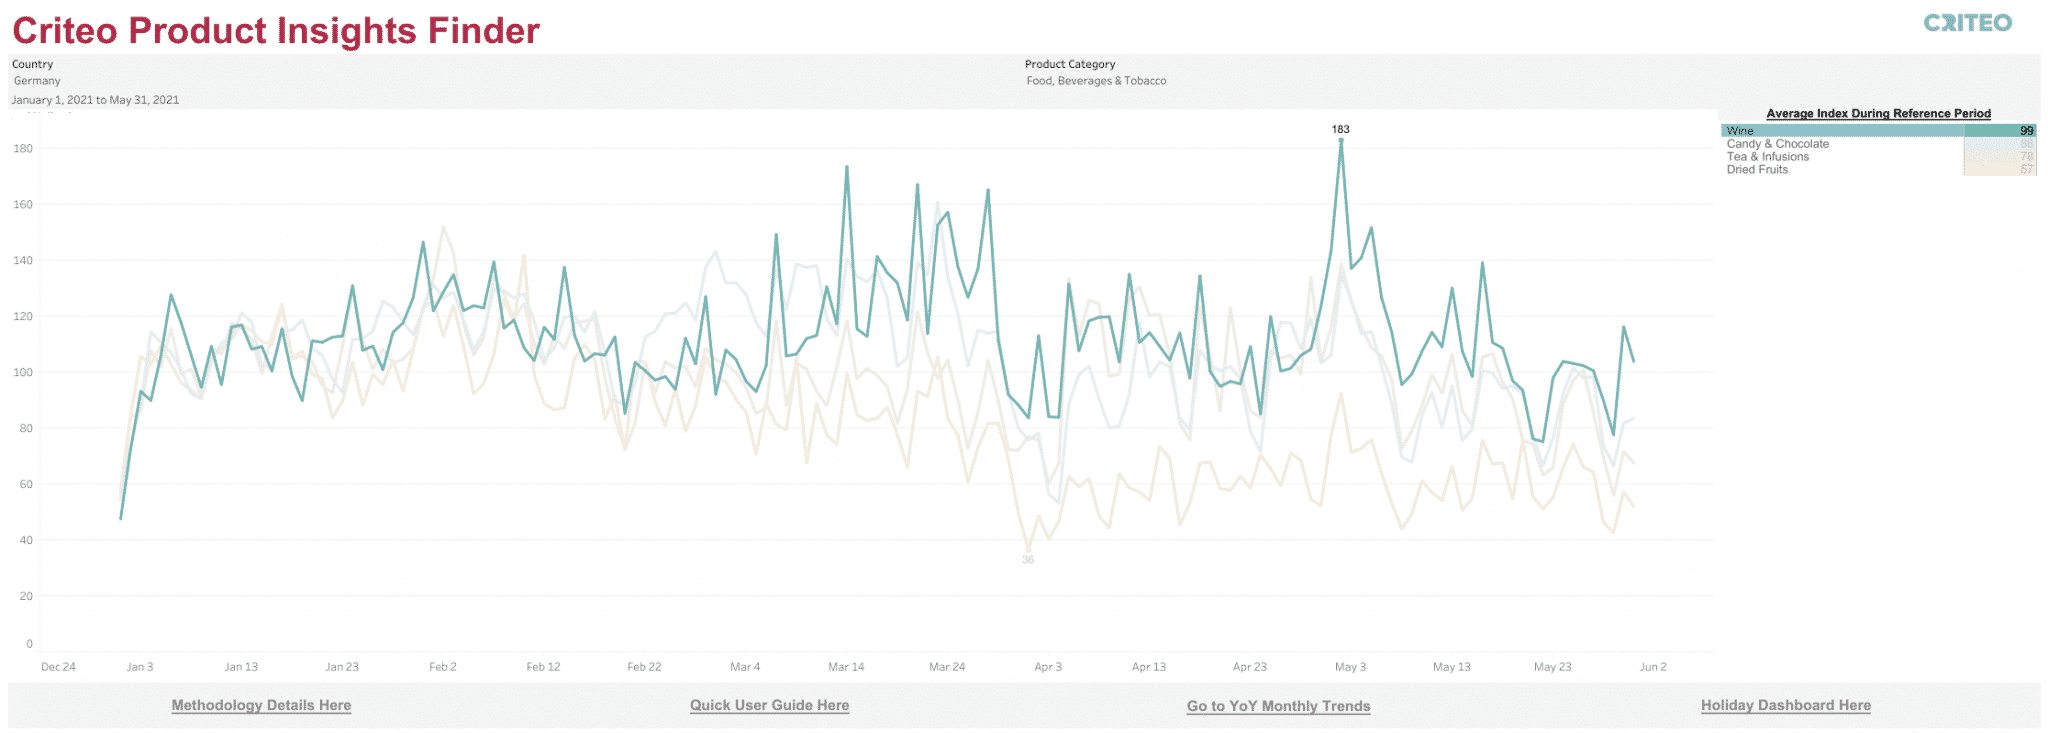
For example, the chart below shows that wine sales in Germany hit a peak on May 2, with an 83% increase compared to early January 2021.
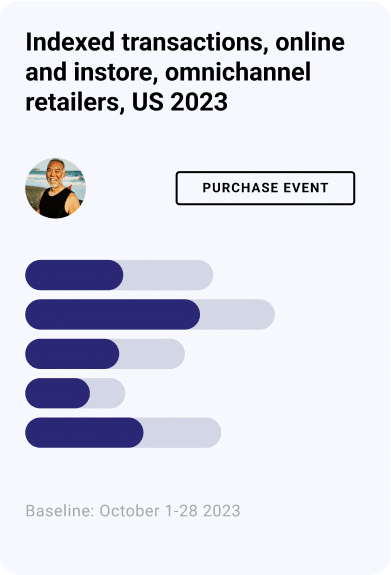
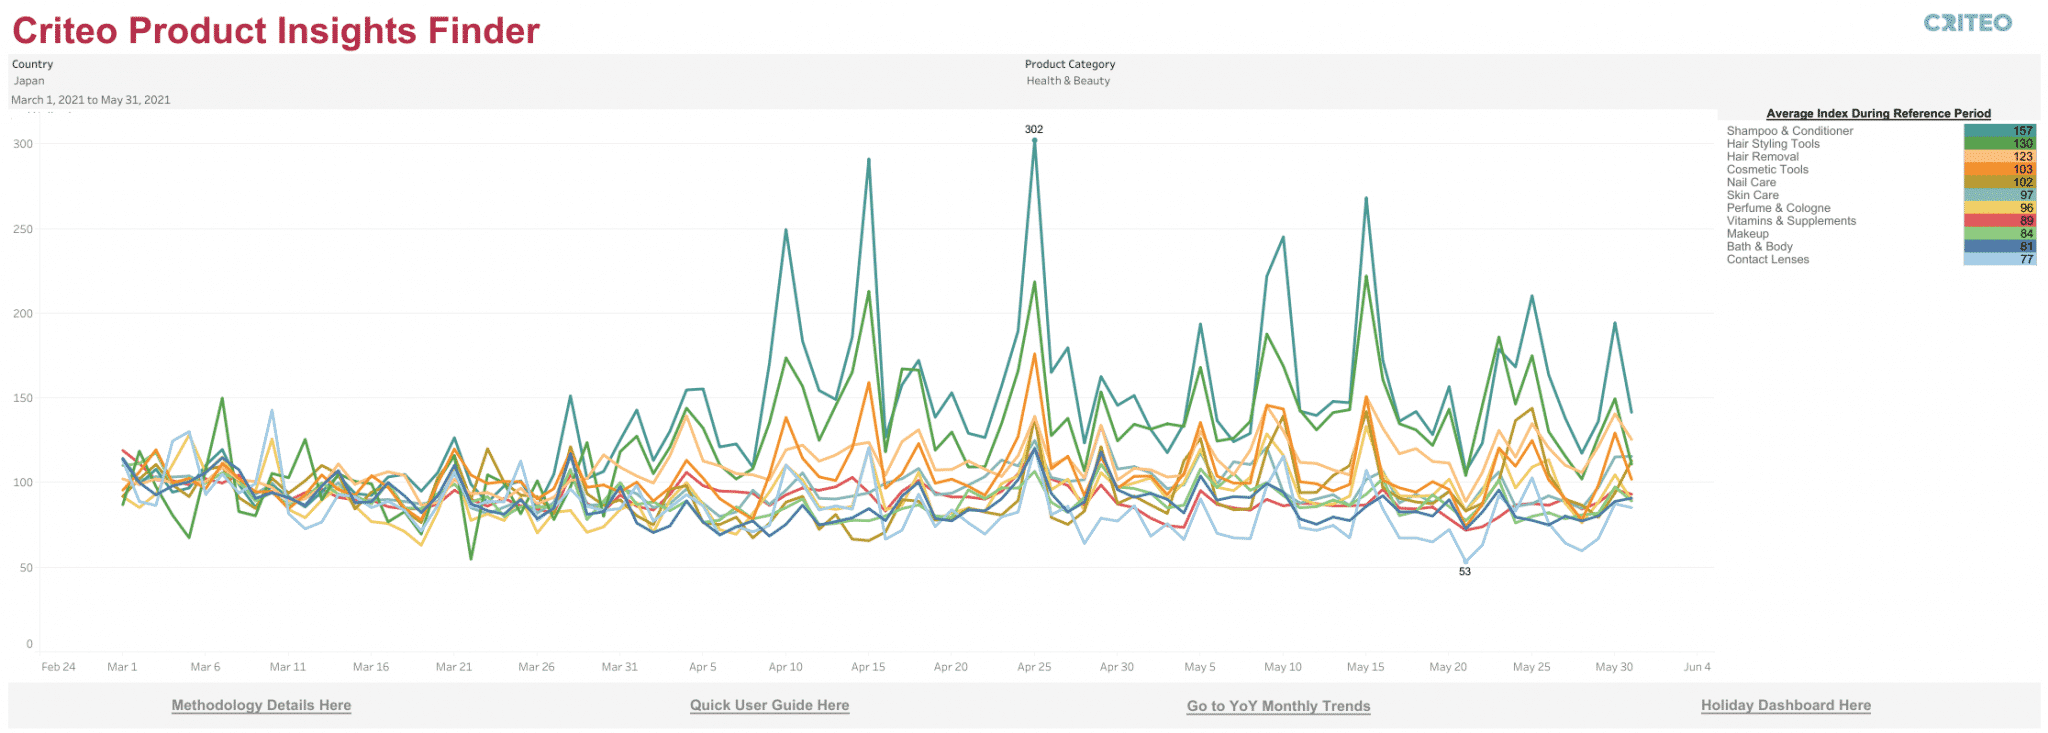
And this chart shows that hair care products were hot throughout Q2 in Japan, with shampoo and conditioner and hair styling tools leading the pack.
What the Numbers Mean
Let’s stick with the German wine sales example. On May 2 the “Wine” subcategory was indexing at 183 in our data. This means that if we saw, on average, 100 sales per day of wine from January 1-14 (the baseline), and then we saw 183 sales of wine on May 2, we could say that sales of wine increased by 83% in Germany on May 2.
On the right-hand side, you’ll see product subcategories ranked in order of average indexed sales growth during the reference period (the last seven days, or in this case, May 24 – May 31). This does not mean Wine was ranked #1 in terms of total sales, it means Wine was ranked #1 in terms of sales growth that week, compared to Jan 1-14, at an average sales index of 99.
Commerce Trends for All
Winning in commerce media means understanding the trends driving the market. We’re here to help both marketers and media owners get the data they need to succeed. Dig into our data below or view the full screen dashboard here.